When most traders look at the stock market, they focus on index levels like the Nifty 50 or Sensex. But here’s the truth: an index alone doesn’t tell you what’s really happening inside the market.
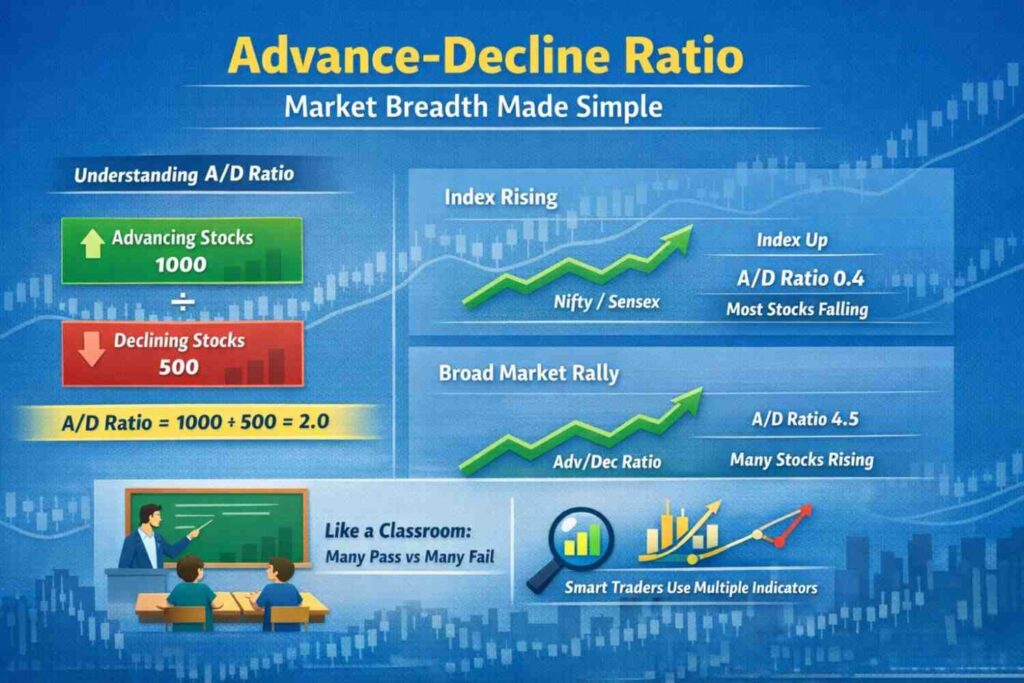
Sometimes the index rises because a few heavyweight stocks are moving up, while the majority of stocks are actually falling. That’s where market breadth indicators come into play — and one of the simplest yet most powerful tools is the Advance-Decline Ratio (A/D Ratio).
In this guide, I’ll explain the Advance-Decline Ratio in simple language, how it works, how to use it in real-time trading, and why serious traders keep an eye on it daily.
What is the Advance-Decline Ratio?
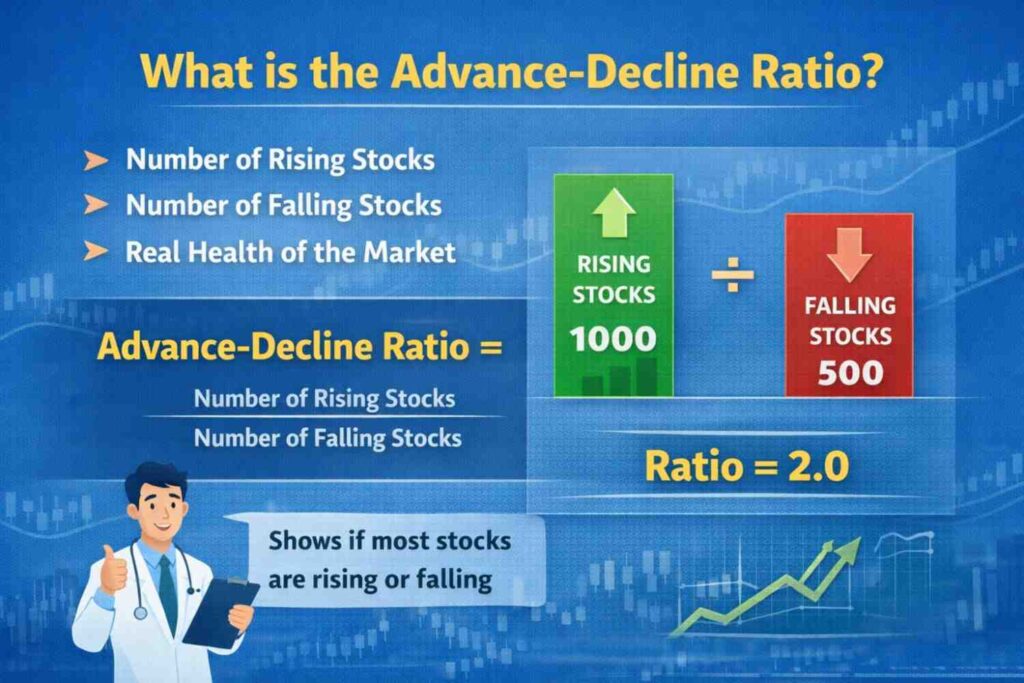
The Advance-Decline Ratio measures the number of advancing stocks versus declining stocks in a market during a specific period (usually one trading day).
It tells you whether:
- More stocks are rising 📈
- More stocks are falling 📉
- Or the market is evenly balanced
In simple words, it shows the health of the overall market, not just the index number.
How is Advance-Decline Ratio Calculated?
The formula is straightforward:
Advance-Decline Ratio = Number of Advancing Stocks ÷ Number of Declining Stocks
Example:
- Advancing Stocks = 1200
- Declining Stocks = 800
A/D Ratio = 1200 ÷ 800 = 1.5
This means for every 1 stock falling, 1.5 stocks are rising — a bullish sign.
If:
- Ratio > 1 → Market strength
- Ratio < 1 → Market weakness
- Ratio = 1 → Balanced market
Simple, but extremely powerful.
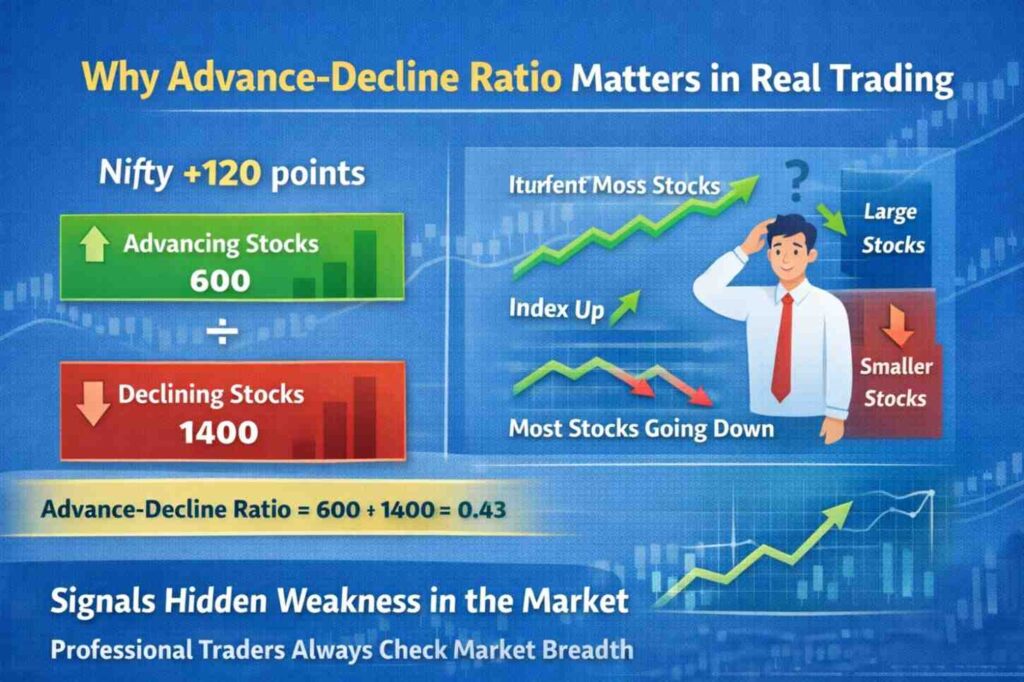
Why Advance-Decline Ratio Matters in Real Trading
Imagine this scenario:
The Nifty 50 is up 150 points. On the surface, everything looks positive. But when you check market breadth:
- Advancing Stocks: 600
- Declining Stocks: 1500
A/D Ratio = 0.40
That means most stocks are actually falling.
This situation often signals hidden weakness. The index might be up because of heavyweights like banking or IT stocks, but broader market participation is missing.
Professional traders don’t ignore this signal.
Example
Let’s take a practical situation from Indian markets.
During a strong rally phase, suppose:
- National Stock Exchange of India reports:
- Advances: 1700
- Declines: 400
A/D Ratio = 4.25
This shows broad-based participation. Such rallies are usually stronger and more sustainable because most sectors are contributing.
On the other hand, if only 10–15 large-cap stocks push the index higher while midcaps and smallcaps fall, the rally may not sustain long.
This is why intraday traders, swing traders, and even investors track A/D Ratio daily.
Understanding Market Breadth in Simple Terms
Think of the market like a classroom.
If:
- 45 students pass
- 5 students fail
The class performance is strong.
But if:
- 10 students score high
- 40 fail
You cannot call it a successful class.
Similarly, if only a handful of stocks are driving the index, the market isn’t truly strong.
The Advance-Decline Ratio helps you see the real participation level.
How Intraday Traders Use Advance-Decline Ratio
Intraday traders combine price action with market breadth.
Morning Setup Strategy:
- Check A/D Ratio after first 30–45 minutes.
- If Nifty is rising and A/D Ratio > 2 → Strong bullish momentum.
- If Nifty is rising but A/D Ratio < 1 → Be cautious.
This filter improves trade selection.
For example:
If banking stocks are strong and A/D Ratio confirms broader participation, buying breakouts becomes more reliable.
Swing Trading with Advance-Decline Ratio
Swing traders use A/D trends over several days.
If:
- Index makes new highs
- But A/D Ratio keeps falling
This is called breadth divergence.
It indicates fewer stocks are supporting the rally. Such conditions often appear before market corrections.
Advance-Decline Ratio vs Advance-Decline Line
Many traders confuse these two.
- Advance-Decline Ratio → Daily comparison (short-term view)
- Advance-Decline Line → Cumulative total over time (long-term trend)
The ratio is more useful for short-term traders, while the line is useful for broader trend analysis.
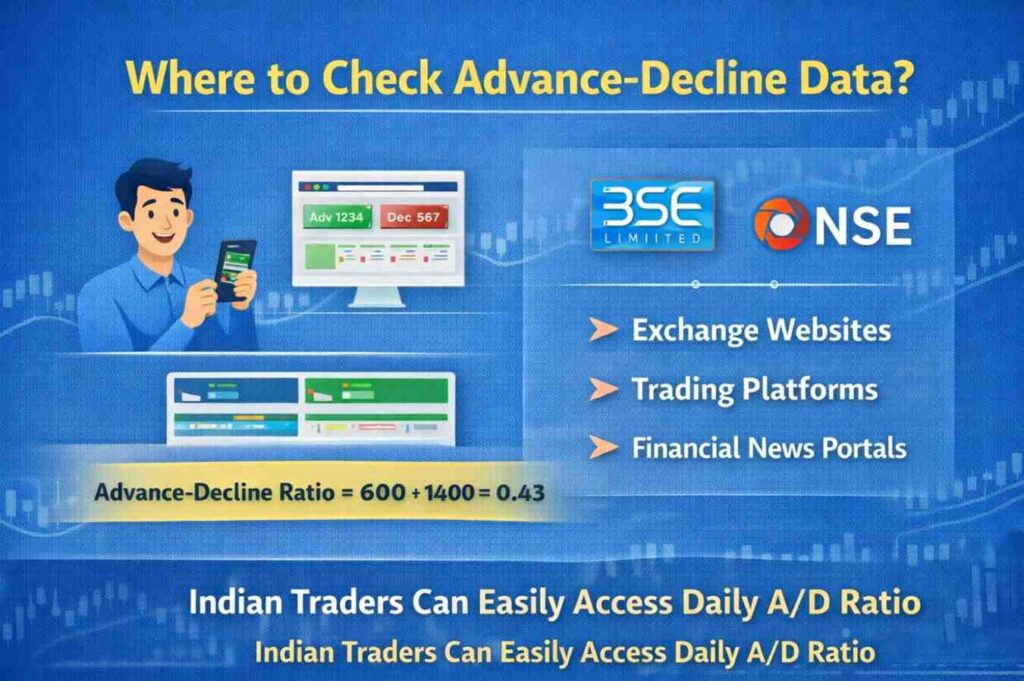
Where to Check Advance-Decline Data?
You can find daily A/D data on:
- Official exchange websites
- Trading platforms
- Financial news portals
For Indian traders, exchanges like BSE Limited publish daily market breadth data.
Best Market Conditions to Use A/D Ratio
The Advance-Decline Ratio works especially well during:
- Breakout days
- Gap-up or gap-down openings
- Volatile sessions
- Trend reversal zones
It acts as a confirmation tool rather than a standalone trading signal.
Smart Traders Combine Indicators
One important thing to understand: professional traders rarely rely on a single indicator.
Smart traders use:
- Trend indicators
- Volume analysis
- Market breadth tools like A/D Ratio
Because combining multiple indicators increases the probability of successful trades.
If you want to understand how volume confirms price movement, you can also read our detailed guide on Volume Analysis in Trading, where we explain how participation strength supports breakouts and reversals.
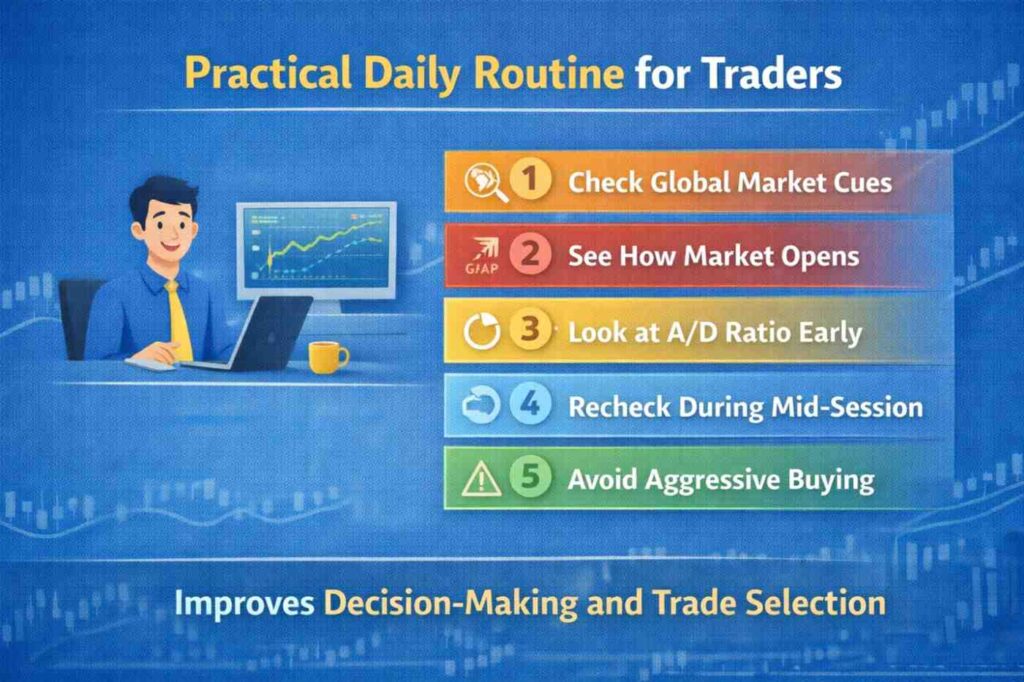
Practical Daily Routine for Traders
Here’s a simple routine you can follow:
- Check global market cues.
- Observe pre-market trend.
- Note opening A/D Ratio.
- Recheck breadth at mid-session.
- Avoid aggressive buying if breadth weakens.
This habit alone can improve decision-making significantly.
Frequently Asked Questions (FAQ)
Can Advance-Decline Ratio predict market crash?
It doesn’t directly predict crashes, but persistent low breadth during index highs can warn of possible corrections.
Is A/D Ratio useful for long-term investors?
Yes, especially when analyzing broader market strength before major investment decisions.
Does A/D Ratio work in intraday trading?
Absolutely. Many intraday traders use it as a confirmation tool for momentum trades.
Is Advance-Decline Ratio better than RSI or MACD?
It serves a different purpose. RSI and MACD measure momentum of a particular stock or index, while A/D Ratio measures overall market participation.
For More Updates About Stock Market Click Here
For More Updates About Income Tax Click Here
For More Updates About Personal Finance Click Here
For More Updates About Government Scheme Click Here