Understanding the Advance-Decline Ratio (A/D Ratio)
Key Highlights
- The A/D Ratio measures the number of rising stocks vs. falling stocks.
- It helps identify “hidden weakness” when an index rises on low participation.
- A ratio > 1 indicates market strength; < 1 indicates market weakness.
- Professional traders use it to confirm breakouts and spot potential reversals.
What is the Advance-Decline Ratio?
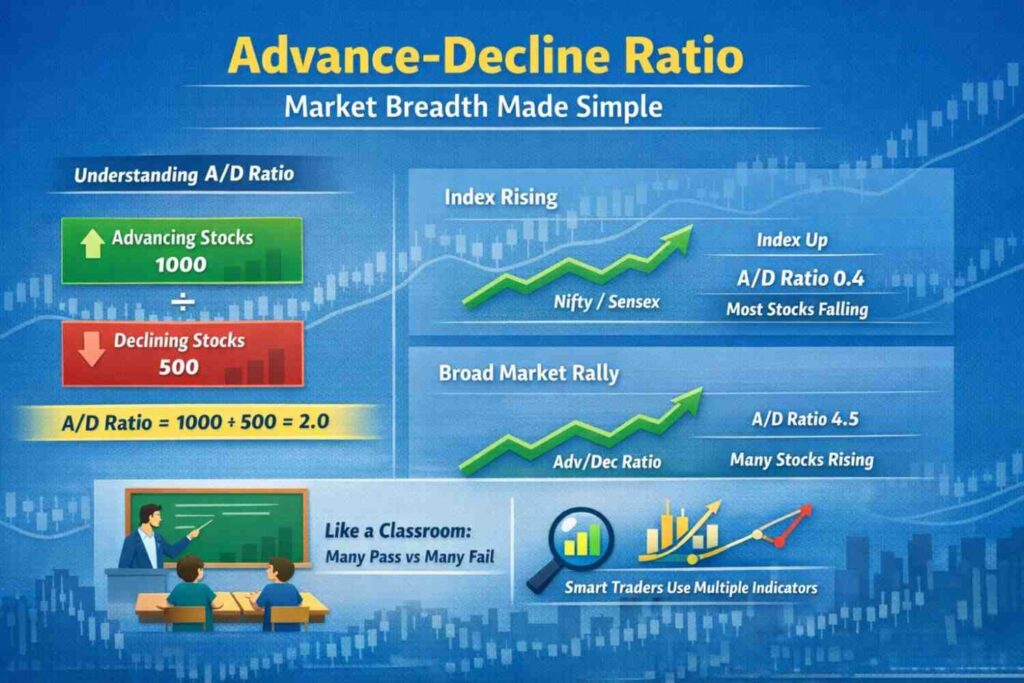
The Advance-Decline Ratio measures the number of advancing stocks versus declining stocks in a market during a specific period (usually one trading day). It tells you whether:
- More stocks are rising 📈
- More stocks are falling 📉
- Or the market is evenly balanced
In simple words, it shows the health of the overall market, not just the index number.
How is the Advance-Decline Ratio Calculated?
The formula is straightforward:
Advance-Decline Ratio = Number of Advancing Stocks ÷ Number of Declining Stocks
| Scenario | Calculation | Interpretation |
|---|---|---|
| Bullish Market | 1200 Advances / 800 Declines | 1.5 (Strength) |
| Bearish Market | 600 Advances / 1500 Declines | 0.4 (Weakness) |
| Balanced Market | 1000 Advances / 1000 Declines | 1.0 (Neutral) |
Why A/D Ratio Matters in Real Trading
Imagine the Nifty 50 is up 150 points. On the surface, it looks positive. But if only 600 stocks are advancing while 1500 are declining, the A/D Ratio is 0.40.
This signals that the index is being propped up by a few heavyweights (like large banks or IT firms) while the broader market is actually bleeding. Professional traders use this to avoid “bull traps.”
How Intraday and Swing Traders Use It
Intraday Strategy
- Morning Setup: Check the ratio after the first 30–45 minutes of trade.
- Confirmation: If Nifty is rising and A/D Ratio > 2, it indicates strong, reliable momentum.
- Caution: If Nifty is rising but A/D Ratio < 1, the rally lacks "legs" and may reverse.
Swing Trading & Divergence
Swing traders look for Breadth Divergence. If the index makes new highs but the A/D Ratio keeps falling over several days, it indicates fewer stocks are supporting the rally—a classic warning sign of an upcoming correction.
Quick Comparison: Ratio vs. Line
| Feature | Advance-Decline Ratio | Advance-Decline Line |
|---|---|---|
| Timeframe | Daily / Short-term | Cumulative / Long-term |
| Best For | Intraday & Momentum | Trend Analysis |
| Data Point | A single day’s snapshot | A running total over time |
Practical Daily Routine for Traders
- Observe the pre-market trend and global cues.
- Note the opening A/D Ratio to gauge initial sentiment.
- Recheck breadth at mid-session (around 12:30 PM).
- Avoid aggressive buying if the index is high but breadth is weakening.
Frequently Asked Questions (FAQ)
Can Advance-Decline Ratio predict market crash?
It doesn’t directly predict crashes, but persistent low breadth during index highs can warn of possible corrections.
Is A/D Ratio useful for long-term investors?
Yes, especially when analyzing broader market strength before major investment decisions.
Does A/D Ratio work in intraday trading?
Absolutely. Many intraday traders use it as a confirmation tool for momentum trades.
Is Advance-Decline Ratio better than RSI or MACD?
It serves a different purpose. RSI and MACD measure momentum of a particular stock or index, while A/D Ratio measures overall market participation.
Continue Reading – Financial Knowledge Hub
Stay informed with our expert-written articles designed to simplify complex financial concepts and help you make better financial decisions.