Introduction
In the world of trading, volatility plays a crucial role in deciding when to enter, exit, or protect a trade. Many beginners focus only on price direction, but experienced traders know that understanding how much price moves is equally important.
This is where the Average True Range (ATR) becomes extremely useful. ATR helps traders measure market volatility and place smarter stop-loss levels instead of guessing. In this guide, you will learn the meaning, formula, real-time example, uses, benefits, and practical trading tips for ATR in a simple and beginner-friendly way.
What Is Average True Range (ATR)?
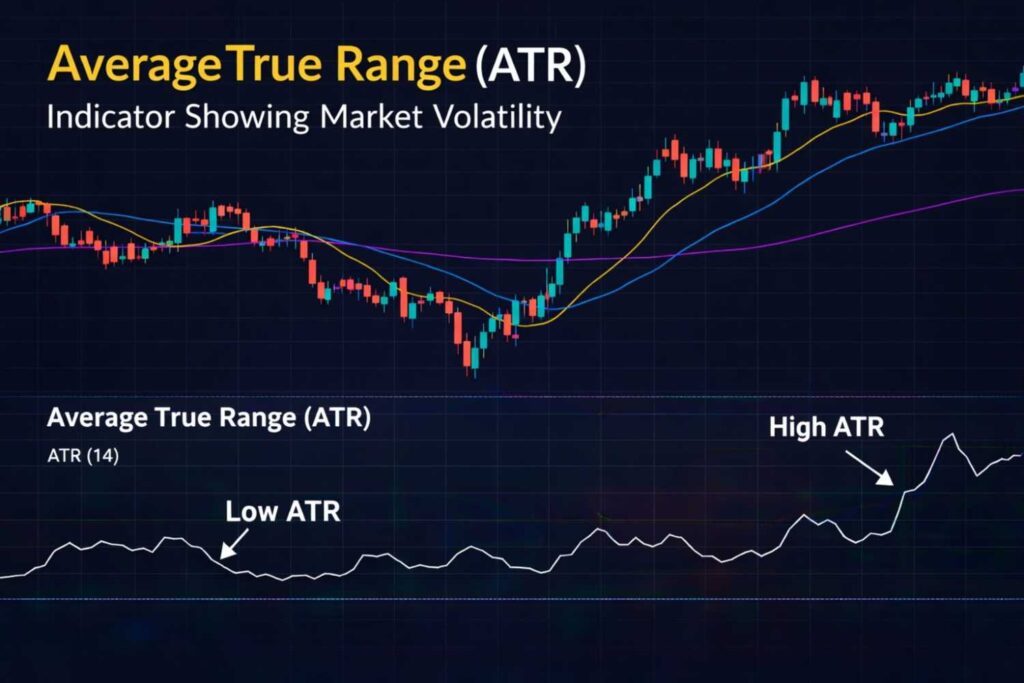
Average True Range (ATR) is a technical indicator that measures market volatility.
It does not show trend direction. Instead, it tells you how strongly price is moving during a specific period.
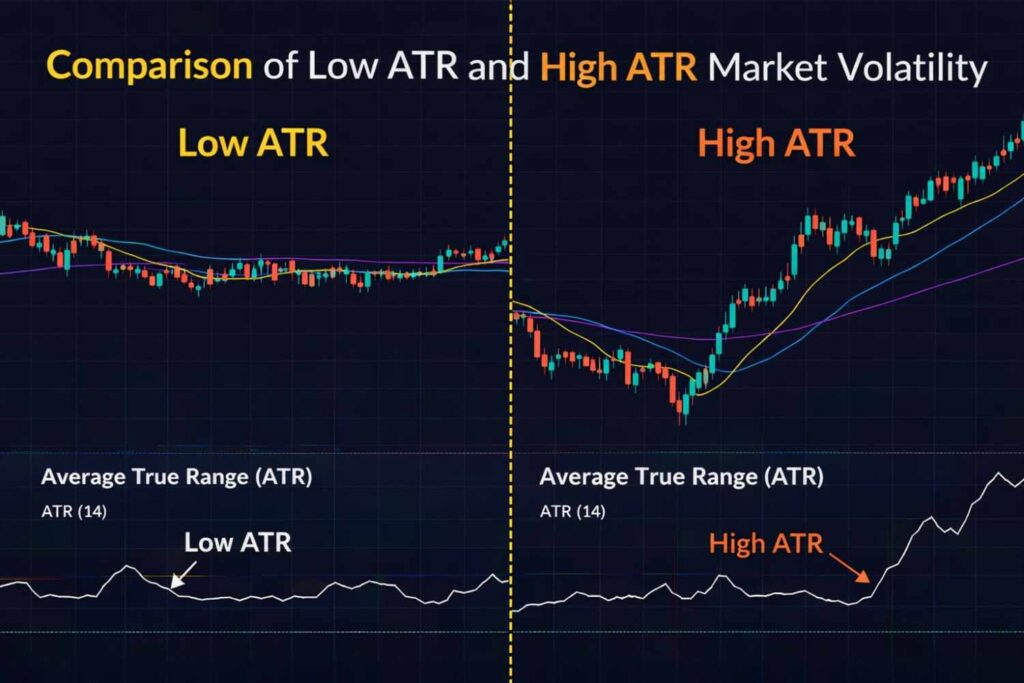
- High ATR → Strong volatility, big price swings
- Low ATR → Calm market, small price movements
Because of this, ATR is widely used for stop-loss placement, position sizing, and breakout confirmation.
ATR Indicator Formula (Simple Explanation)
ATR is calculated in two steps:
Step 1: True Range (TR)
True Range is the largest of these three values:
- Current High − Current Low
- |Current High − Previous Close|
- |Current Low − Previous Close|
Step 2: Average of True Range
ATR = Moving Average of True Range (usually 14 periods)
This smoothing helps traders understand consistent volatility instead of random spikes.
How ATR Works in Trading
ATR expands and contracts based on market activity:
When ATR Rises
- Market becomes volatile
- Breakouts or strong trends may begin
- Wider stop-loss is needed
When ATR Falls
- Market becomes quiet or sideways
- Breakouts are less reliable
- Tight stop-loss may work
Think of ATR as a speedometer of price movement.
ATR Symbol & Settings
- Indicator Name: ATR
- Default Period: 14
- Best Timeframes:
- Intraday → 5-min, 15-min
- Swing Trading → Daily chart
- Positional Trading → Weekly chart
Beginners should start with 14-period ATR, as it balances accuracy and smoothness.
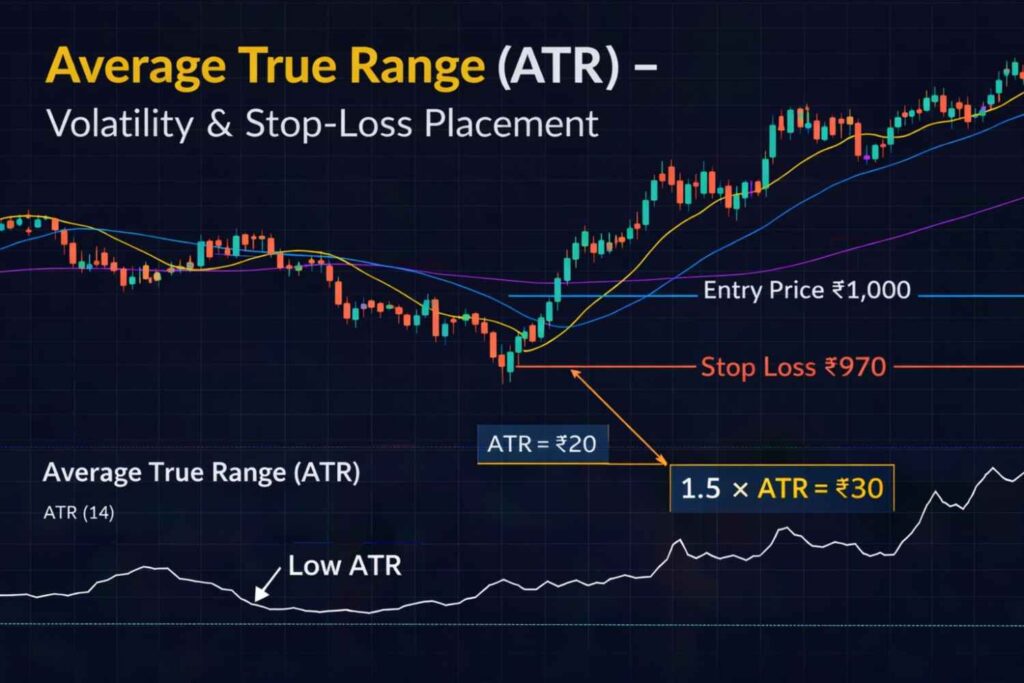
Real-Time Market Example of ATR
Imagine a stock trading at ₹1,000 with an ATR value of ₹20.
This means the stock usually moves ₹20 per day.
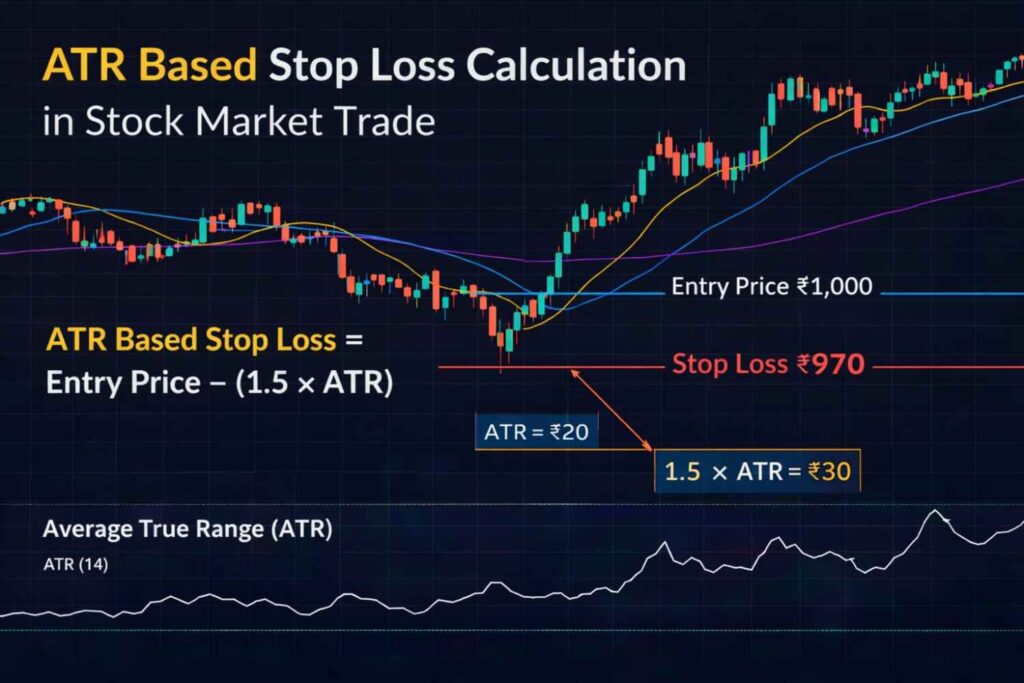
Stop-Loss Placement Using ATR
Common method:
- Stop-loss = Entry Price − (1.5 × ATR)
Example:
- Entry = ₹1,000
- ATR = ₹20
- Stop-loss = ₹1,000 − ₹30 = ₹970
This prevents early stop-outs caused by normal volatility.
Practical Uses of ATR in Trading
1. Smart Stop-Loss Placement
ATR helps set volatility-based stop-loss, not random numbers.
2. Position Sizing
Higher ATR → Reduce quantity
Lower ATR → Increase quantity
This keeps risk consistent across trades.
3. Breakout Confirmation
A sudden ATR rise often confirms:
- Trend beginning
- Strong momentum
- Possible continuation move
4. Identifying Quiet Markets
Very low ATR signals:
- Sideways market
- Range trading opportunity
- Wait before breakout trading
Benefits of Using ATR
- Easy to understand and beginner-friendly
- Works in stocks, forex, crypto, and commodities
- Helps avoid emotional stop-loss decisions
- Useful for risk management and trade planning
- Effective in all timeframes
Limitations of ATR Indicator
- Does not show buy or sell signals
- Cannot predict trend direction
- May lag during sudden news events
- Needs combination with trend indicators
Because of this, ATR should be used with:
Pro Trading Tips for ATR Users
- Use 1.5× ATR for normal stop-loss
- Use 2× ATR in highly volatile markets
- Combine ATR with trend confirmation indicators
- Avoid trading when ATR is extremely low
- Trail stop-loss using ATR multiples to lock profit
Professional traders treat ATR as a risk-control tool, not a signal generator.
If you want to strengthen your trading accuracy, you should also learn about trend-following indicators that work perfectly with ATR. For example, combining ATR-based stop-loss with moving averages can significantly improve risk-reward ratio and trade confidence.
Conclusion
Understanding Average True Range (ATR) can completely change the way you manage risk in trading. Instead of placing emotional or random stop-loss levels, ATR allows you to follow market-based logic.
While ATR does not predict direction, it remains one of the most powerful volatility tools for protecting capital and improving long-term consistency. Start using ATR with proper risk management, stay disciplined, and your trading decisions will become more confident and professional over time.
Frequently Asked Questions (FAQs)
What is the best ATR setting?
The 14-period ATR is the most commonly used and reliable default setting.
Can ATR give buy or sell signals?
No. ATR only measures volatility, not direction.
It should be combined with other indicators.
How much ATR stop-loss is best?
Most traders use:
1.5× ATR → Normal trades
2× ATR → High-volatility trades
Does ATR work in intraday trading?
Yes. ATR is widely used in intraday, swing, and positional trading.
For More Updates About Stock Market Click Here
For More Updates About Income Tax Click Here
For More Updates About Personal Finance Click Here
For More Updates About Government Scheme Click Here