Bollinger Bands are one of the most popular technical indicators used by traders to measure market volatility and identify potential breakouts. Whether you trade stocks, forex, or crypto, Bollinger Bands help you understand when price is too high, too low, or ready for a big move.
What Are Bollinger Bands?
Bollinger Bands are a volatility-based indicator created by John Bollinger.
They consist of three lines plotted on a price chart:
- Middle Band – Simple Moving Average (SMA)
- Upper Band – SMA + Standard Deviation
- Lower Band – SMA – Standard Deviation
The distance between the bands expands and contracts based on market volatility.
Bollinger Bands Formula (Simple Explanation)
- Middle Band = 20-period SMA
- Upper Band = 20-SMA + (2 × Standard Deviation)
- Lower Band = 20-SMA − (2 × Standard Deviation)
You don’t need to calculate this manually—your trading platform does it automatically.
Why Bollinger Bands Are Important
Bollinger Bands help traders to:
✔ Measure market volatility
✔ Identify overbought & oversold levels
✔ Spot price breakouts
✔ Understand price consolidation
✔ Improve entry & exit timing
How to Read Bollinger Bands
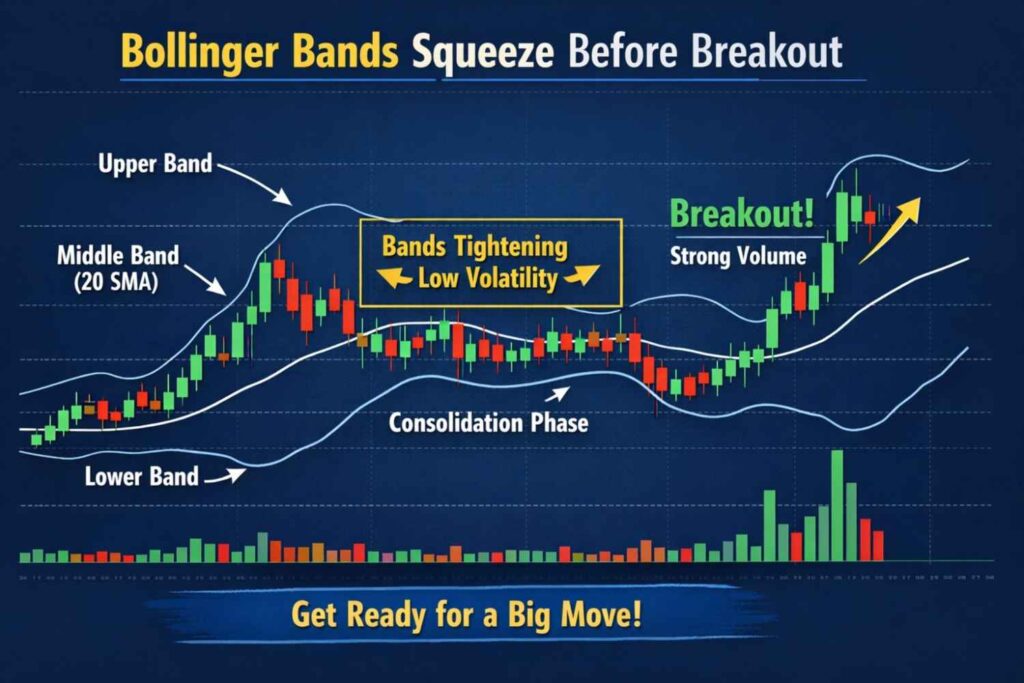
1️⃣ Narrow Bands = Low Volatility
When the bands squeeze tightly, it means the market is quiet and a big move may be coming.
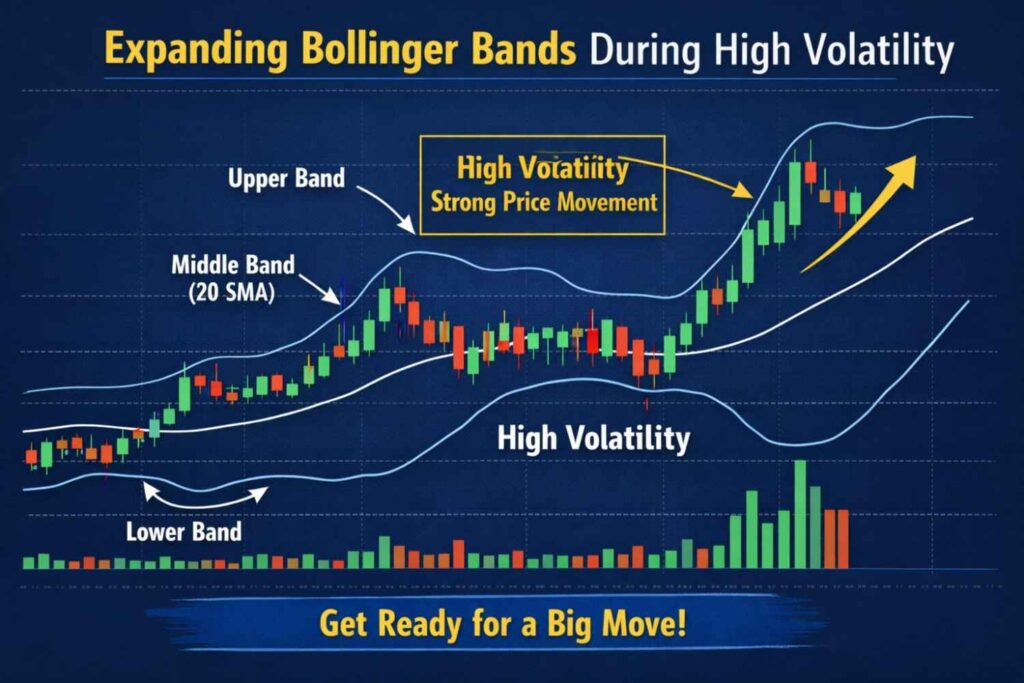
2️⃣ Wide Bands = High Volatility
When bands widen, the market is active, and strong price movement is already happening.
Bollinger Bands Breakout Strategy (Most Popular Use)
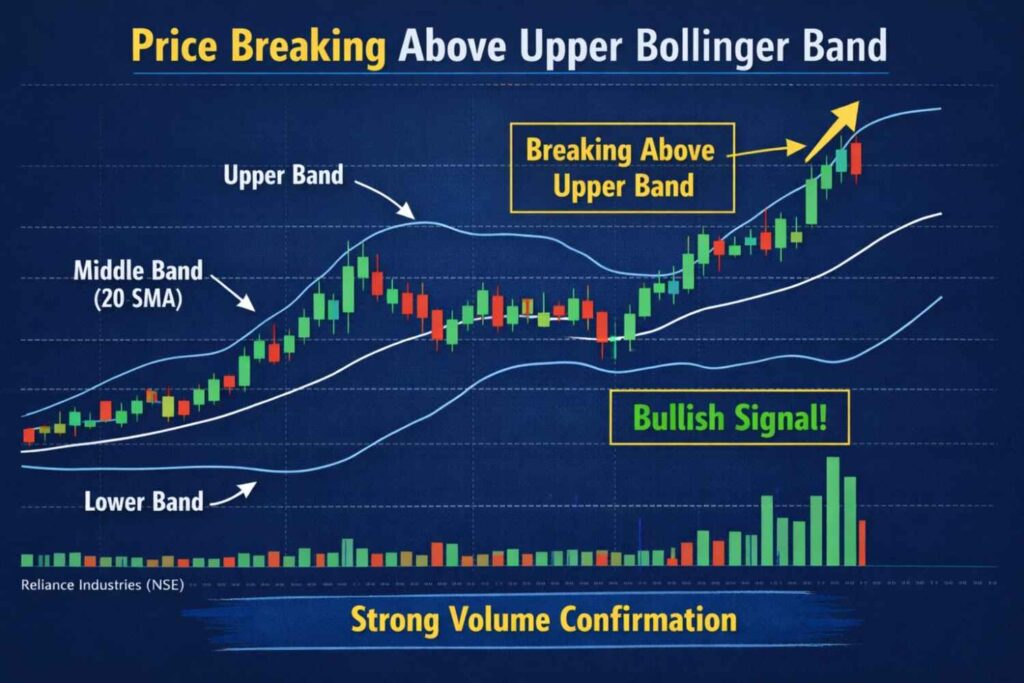
🔹 Upper Band Breakout (Bullish)
- Price closes above the upper band
- Indicates strong buying pressure
- Often signals the start of an uptrend
Traders look for high volume confirmation
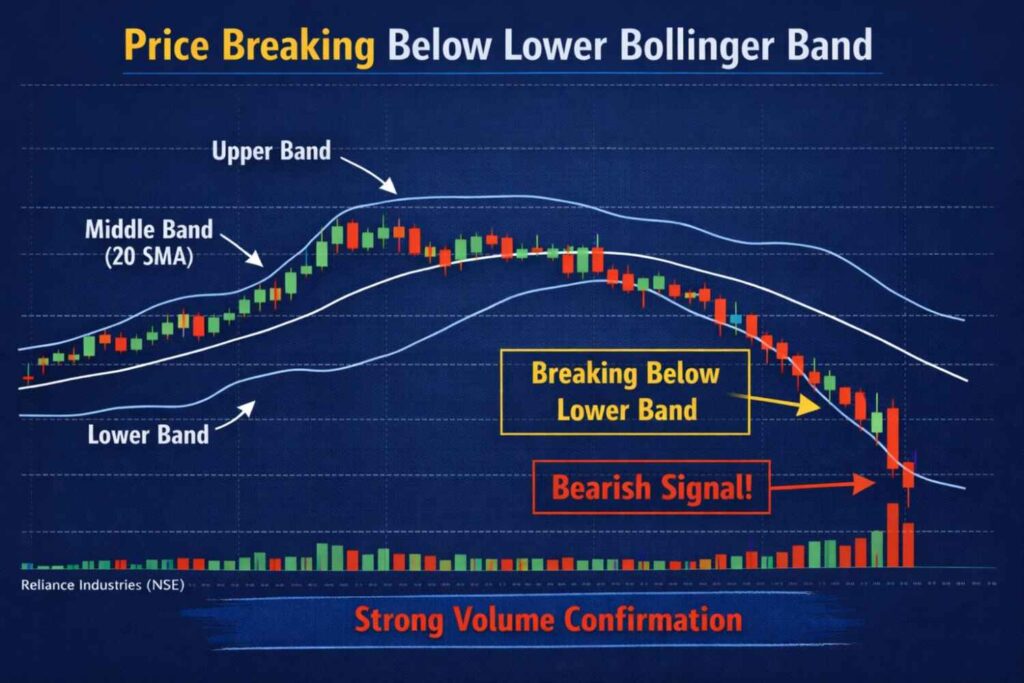
🔹 Lower Band Breakout (Bearish)
- Price closes below the lower band
- Indicates strong selling pressure
- Often signals a downtrend
Real-Time Trading Example (Stock Market)
Example: Reliance Industries (NSE)
- Timeframe: Daily Chart
- Bollinger Bands: 20 SMA, 2 SD
- Price stayed inside bands for many days (low volatility)
- Bands started squeezing
- Sudden breakout above Upper Band
- Volume increased
- Stock moved 6–8% upward in the next few sessions
Conclusion: Bollinger Band squeeze + breakout = high-probability trade
Bollinger Bands & Overbought / Oversold Zones
| Condition | Meaning |
|---|---|
| Price near Upper Band | Overbought (not always sell) |
| Price near Lower Band | Oversold (not always buy) |
| Price bouncing between bands | Range-bound market |
Important:
Price can stay overbought or oversold during strong trends.
Best Indicator Combination with Bollinger Bands
For better accuracy, traders combine Bollinger Bands with:
✔ RSI (Relative Strength Index)
✔ MACD
✔ Volume Indicator
✔ Support & Resistance
Bollinger Bands work best when confirmed with other indicators.
Common Mistakes Traders Make ❌
- Selling immediately when price touches upper band
- Buying immediately when price touches lower band
- Ignoring trend direction
- Trading breakouts without volume confirmation
Final Thoughts
Bollinger Bands are a powerful tool for understanding volatility, breakouts, and price behavior.
They don’t predict the market—but they prepare you for big moves.
Use Bollinger Bands with discipline, confirmation, and risk management for best results.
Frequently Asked Questions (FAQ)
Which timeframe is best for Bollinger Bands?
They work on all timeframes—5 min, 15 min, daily, weekly.
Beginners should start with daily charts.
Are Bollinger Bands accurate?
They are highly effective when used with trend analysis and volume.
Can Bollinger Bands be used for intraday trading?
Absolutely. Many intraday traders use 5-minute and 15-minute charts.
Best settings for Bollinger Bands?
Default and most popular:
Period: 20
Standard Deviation: 2