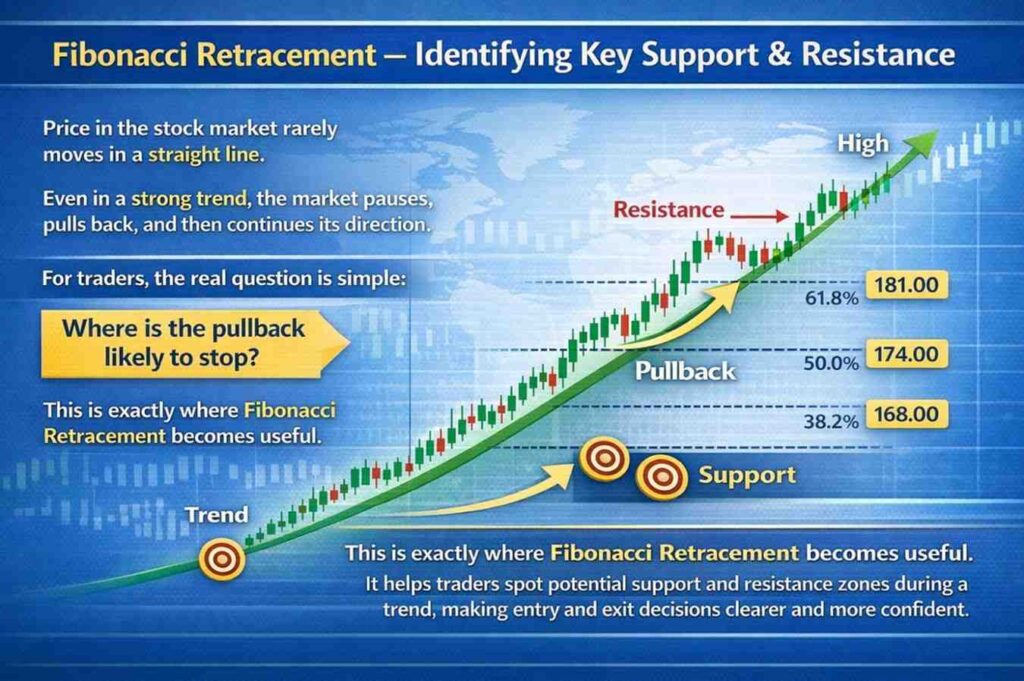
Price in the stock market rarely moves in a straight line.
Even in a strong trend, the market pauses, pulls back, and then continues its direction.
For traders, the real question is simple:
Where is the pullback likely to stop?
This is exactly where Fibonacci Retracement becomes useful.
It helps traders spot potential support and resistance zones during a trend, making entry and exit decisions clearer and more confident.
What Is Fibonacci Retracement in Trading?
Fibonacci Retracement is a technical analysis tool based on the famous Fibonacci number sequence.
In trading, it is used to identify possible reversal or pullback levels after a strong price move.
Instead of guessing where price may bounce, traders use Fibonacci levels to:
- Find support in an uptrend
- Find resistance in a downtrend
- Improve trade timing
- Manage risk more effectively
Fibonacci Indicator Symbol on Chart
On most trading platforms, Fibonacci Retracement appears as:
Horizontal percentage levels drawn between a swing high and swing low.
Common visible levels:
- 23.6%
- 38.2%
- 50%
- 61.8%
- 78.6%
These levels act like hidden support and resistance zones where price often reacts.
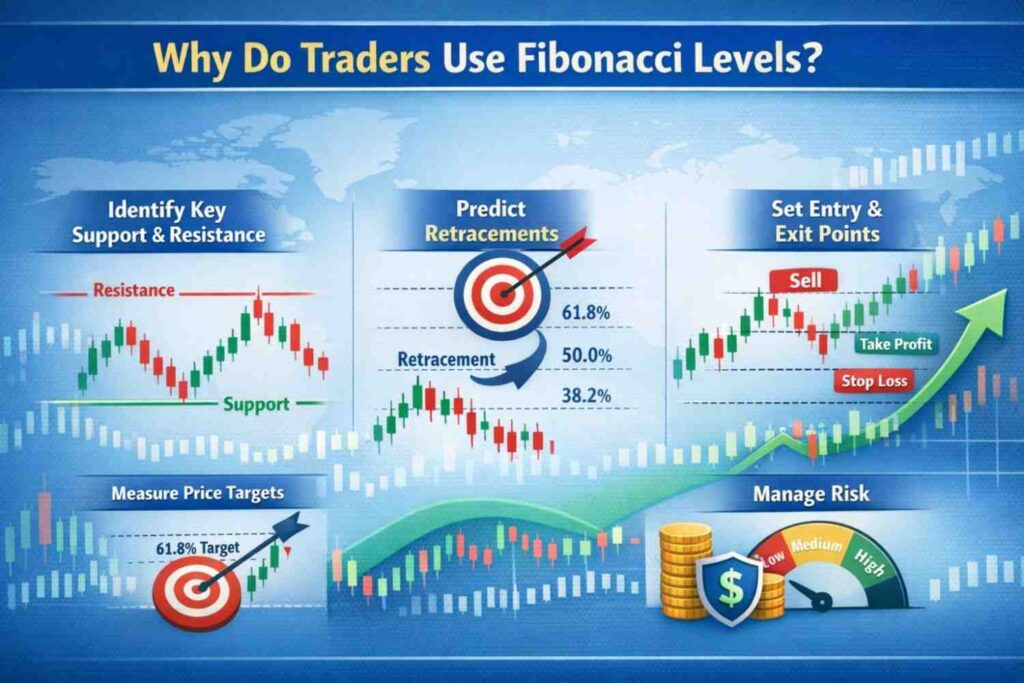
Why Do Traders Use Fibonacci Levels?
Traders prefer Fibonacci because it is:
- Simple to apply
- Based on market psychology
- Useful in all timeframes (intraday to long term)
- Widely followed, which increases reaction probability
When many traders watch the same levels, price reactions become more meaningful.
Key Fibonacci Retracement Levels You Must Know
23.6% – Shallow Pullback
Shows strong trend momentum. Price usually continues quickly.
38.2% – Healthy Retracement
A normal pullback where trend continuation is common.
50% – Psychological Level
Not a Fibonacci ratio mathematically, but very important in trading.
61.8% – Golden Ratio (Strongest Level)
Most watched level. Major support or resistance often forms here.
78.6% – Deep Pullback Zone
Last chance for trend continuation before possible reversal.
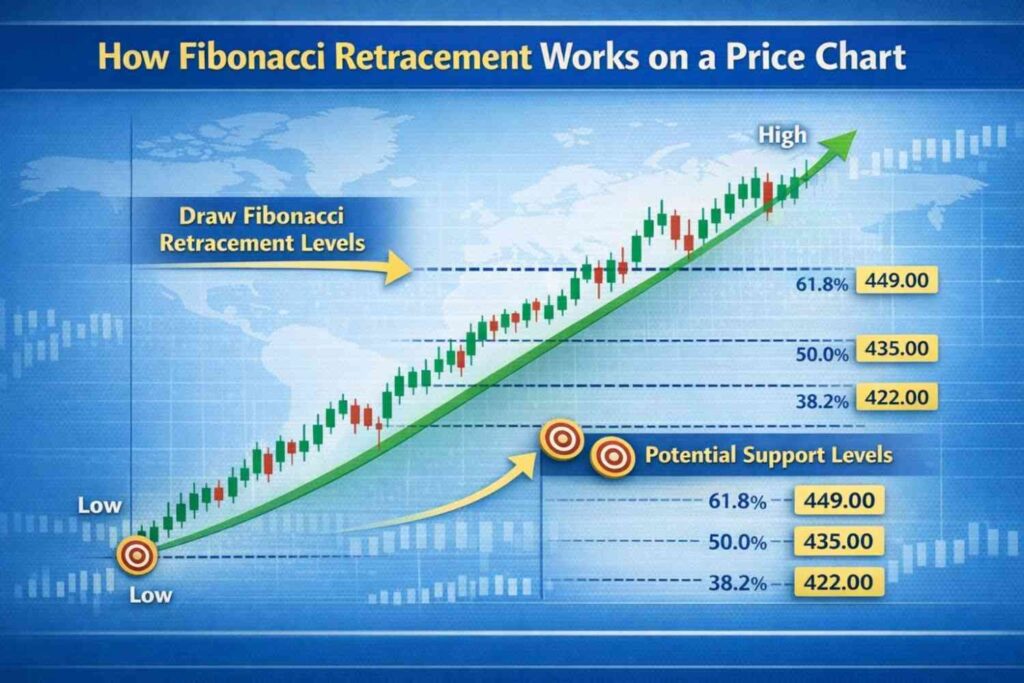
How Fibonacci Retracement Works on a Price Chart
Using Fibonacci is straightforward:
- Identify a clear trend (uptrend or downtrend).
- Draw Fibonacci from swing low to swing high in an uptrend
(reverse for downtrend). - Wait for price to pull back toward key levels.
- Look for confirmation like bullish/bearish candles before entering.
The key idea is simple:
Fibonacci shows zones, not exact prices.
Real-Time Trading Example
Imagine a stock rising strongly from ₹100 to ₹150.
After the rally, price starts pulling back.
- At ₹130 (38.2%) → small bounce appears.
- At ₹125 (50%) → buyers show interest.
- At ₹118 (61.8%) → strong bullish candle forms and trend resumes upward.
A trader entering near 61.8% support gets:
- Better risk-reward ratio
- Clear stop-loss placement
- Higher probability trend continuation
This is how Fibonacci helps in real trading decisions, not just theory.
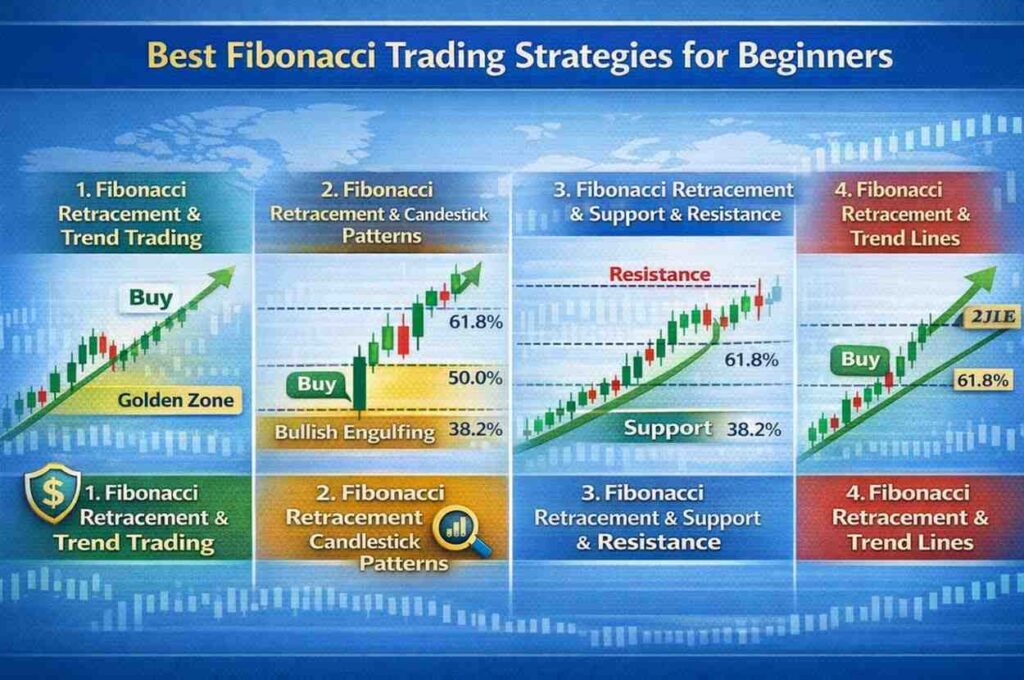
Best Fibonacci Trading Strategies for Beginners
1. Trend Pullback Strategy
Trade only in direction of trend using 38.2%–61.8% zone.
2. Fibonacci + Support/Resistance Confluence
When Fibonacci level matches previous support or resistance, reaction becomes stronger.
3. Fibonacci with Moving Averages
Pullback near 61.8% + moving average gives high-probability setup.
4. Fibonacci with Price Action Candles
Look for pin bar, engulfing, or rejection candle at Fibonacci level.
Important Insight for Smart Traders
Smart traders rarely rely on only one indicator.
They combine Fibonacci with tools like moving averages, RSI, or volume analysis to increase trading probability and avoid false signals.
Using multiple confirmations together creates stronger and more reliable trade setups.
This is why professional traders focus on confluence, not single-indicator decisions.
(You can internally link this paragraph to your other indicator blog posts.)
Common Mistakes Traders Make with Fibonacci
- Drawing Fibonacci on wrong swing points
- Using it in sideways markets
- Entering without confirmation
- Expecting exact reversal at levels
Avoiding these mistakes improves accuracy significantly.
Advantages of Fibonacci Retracement
- Easy for beginners to understand
- Works in any timeframe
- Helps find entry, stop-loss, and target
- Widely respected by market participants
Limitations You Should Know
- Levels are zones, not exact numbers
- Needs confirmation indicators
- Can give false signals in choppy markets
Understanding both strengths and weaknesses makes trading more realistic.
Final Thoughts
Fibonacci Retracement is not a magic formula,
but it is a practical guide to market structure.
It helps traders:
- Understand pullbacks
- Identify key support and resistance
- Improve entry timing
- Manage risk wisely
The real power comes when Fibonacci is used with:
- Trend analysis
- Price action confirmation
- Proper risk management
Mastering this approach can make trading more structured, calm, and disciplined—which is what every successful trader ultimately needs
Frequently Asked Questions (FAQ)
Which Fibonacci level is strongest?
61.8% is considered the most powerful support/resistance level.
Can beginners use Fibonacci?
Yes. It is one of the simplest technical tools to learn.
Does Fibonacci work in intraday trading?
Yes, many intraday traders use it for pullback entries.
Is Fibonacci better than support & resistance?
It works best together with support and resistance, not separately