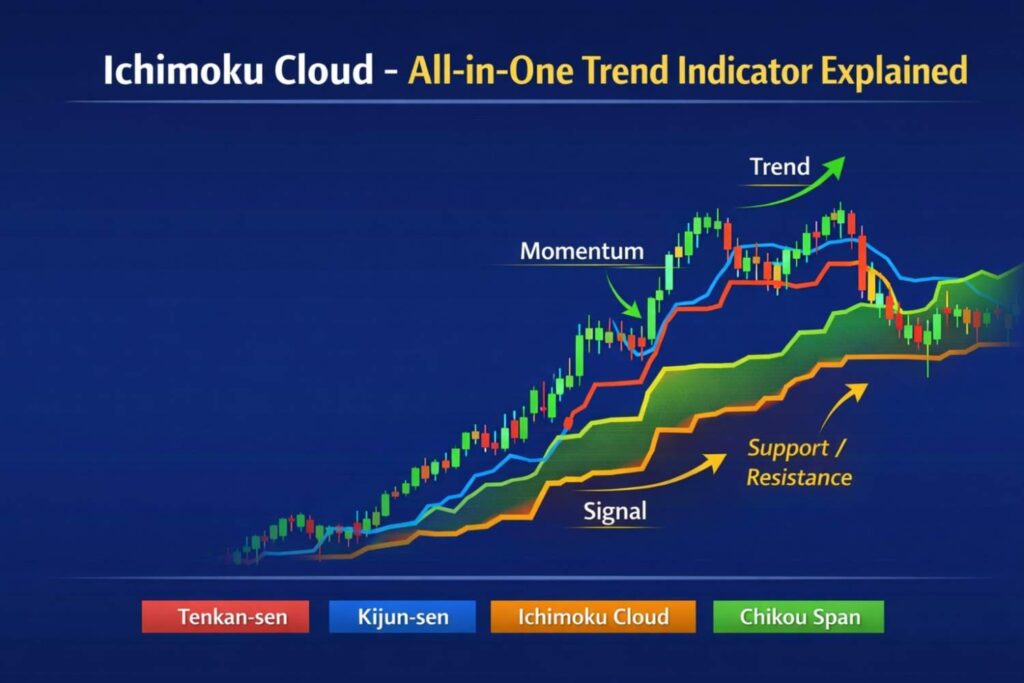
If you are looking for one indicator that shows trend, momentum, support, resistance, and entry signals together, then Ichimoku Cloud might be the perfect tool for you.
Developed by Japanese journalist Goichi Hosoda in the 1930s, Ichimoku was designed to give traders a “one-glance equilibrium chart.” In Japanese, Ichimoku Kinko Hyo means “one look equilibrium chart.”
Ichimoku Cloud Symbol on Trading Platforms
On most platforms like TradingView, the Ichimoku indicator appears as:
Symbol / Name: Ichimoku Cloud or Ichimoku Kinko Hyo
You can find it in the indicator search bar and apply it directly to your stock, forex, or crypto chart.
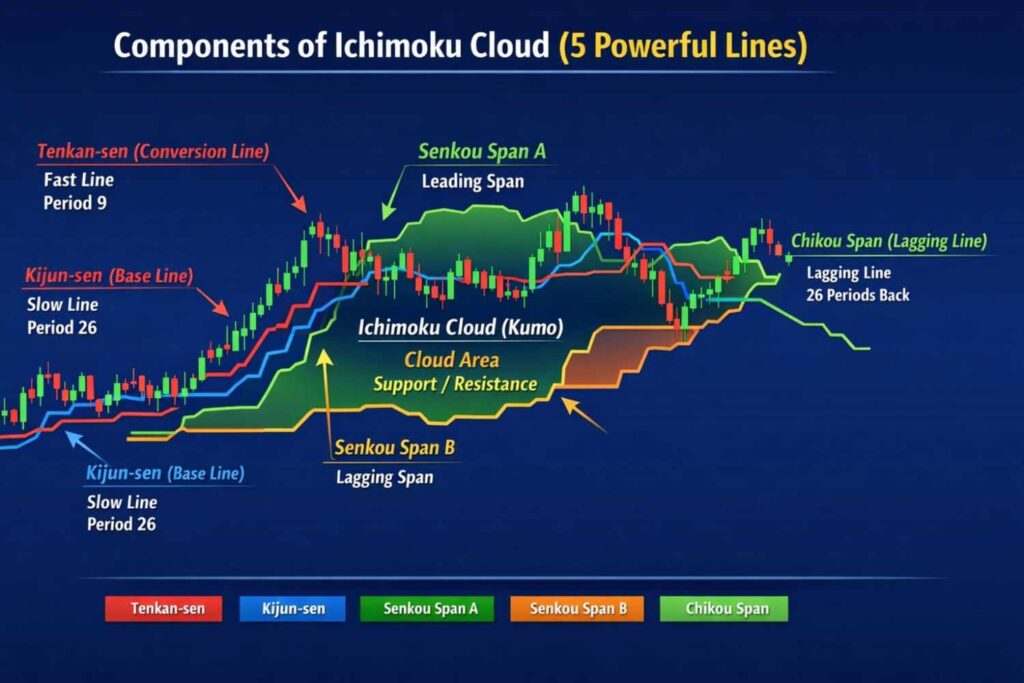
Components of Ichimoku Cloud (5 Powerful Lines)
Ichimoku consists of five lines, and together they form a cloud (called Kumo).
1️⃣ Tenkan-sen (Conversion Line)
- Short-term trend line
- Fast-moving
- Default period: 9
2️⃣ Kijun-sen (Base Line)
- Medium-term trend
- Default period: 26
- Works like dynamic support/resistance
3️⃣ Senkou Span A
- One boundary of the cloud
- Leading span (plotted 26 periods ahead)
4️⃣ Senkou Span B
- Second boundary of the cloud
- Slower and stronger support/resistance
5️⃣ Chikou Span (Lagging Line)
- Current price plotted 26 periods back
- Confirms trend strength
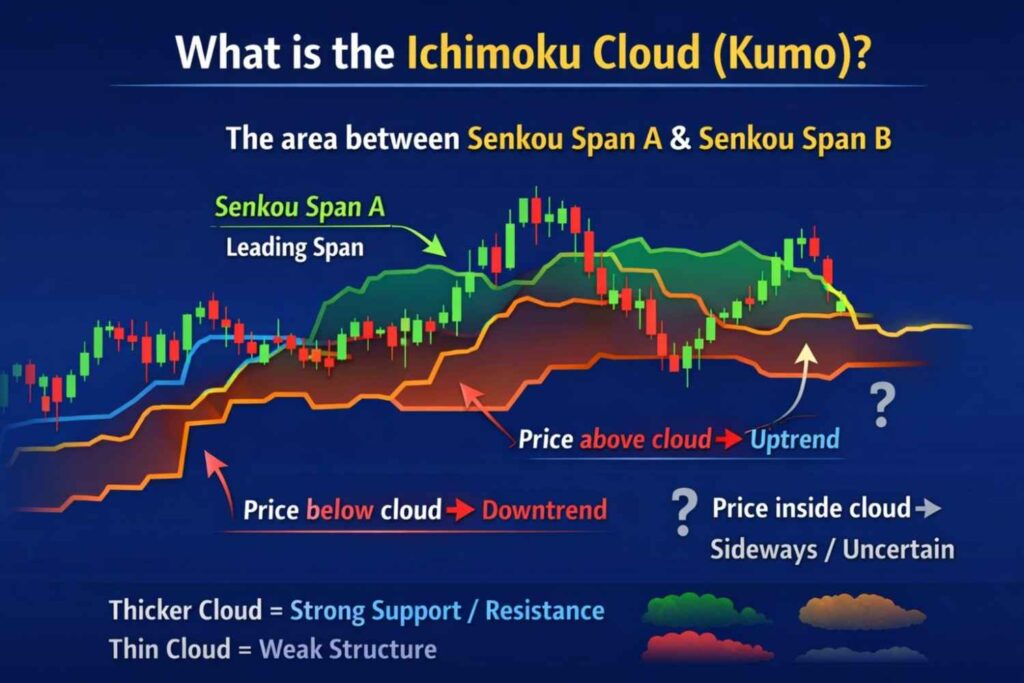
What is the Ichimoku Cloud (Kumo)?
The area between Senkou Span A and B forms the Cloud (Kumo).
- 🔵 Price above cloud → Uptrend
- 🔴 Price below cloud → Downtrend
- ⚪ Price inside cloud → Sideways / Uncertain
Thicker cloud = Strong support/resistance
Thin cloud = Weak structure
Real-Time Example (Stock Market Scenario)
Let’s take an example:
Suppose Reliance Industries stock is trading at ₹2,500.
Scenario:
- Price breaks above the cloud
- Tenkan-sen crosses above Kijun-sen
- Chikou Span is above price
This confirms a strong bullish signal.
A trader may enter near ₹2,520 with stop-loss below Kijun-sen.
After 2 weeks, price moves to ₹2,700.
That’s how Ichimoku helps capture trend early.
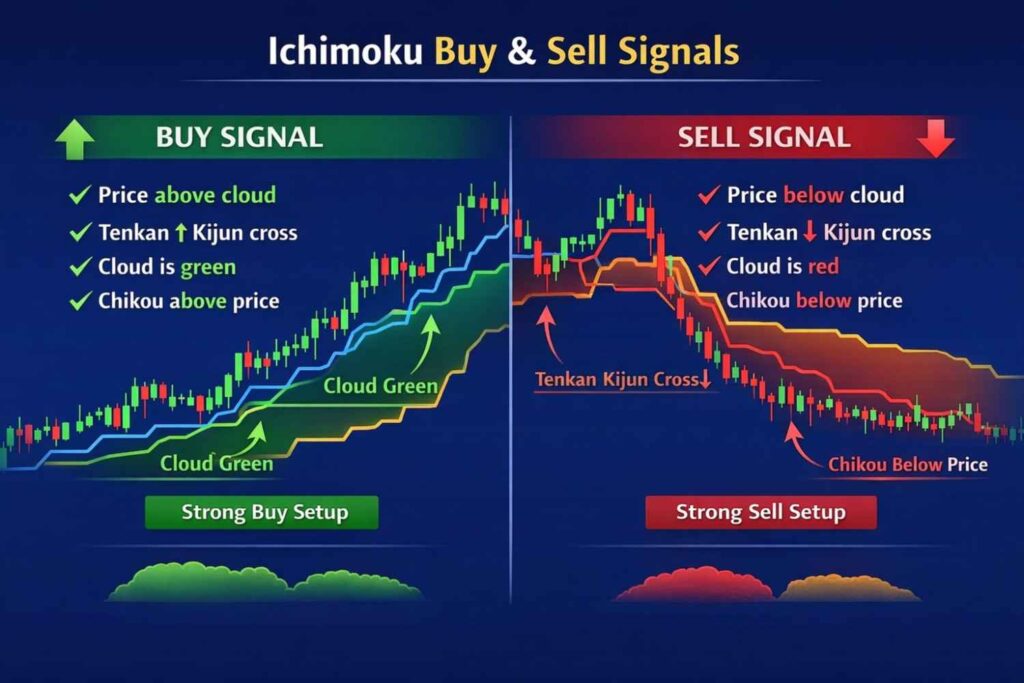
Ichimoku Buy & Sell Signals
Buy Signal (Strong Setup)
✔ Price above cloud
✔ Tenkan crosses above Kijun
✔ Cloud is green (Span A above Span B)
✔ Chikou above price
Sell Signal (Strong Setup)
✔ Price below cloud
✔ Tenkan crosses below Kijun
✔ Cloud is red
✔ Chikou below price
The more confirmations, the stronger the signal.
Ichimoku Trading Strategy (Simple & Practical)
Strategy: Trend-Following Setup
- Wait for price to close above cloud
- Enter on pullback near Kijun-sen
- Place stop-loss below cloud
- Trail stop-loss as price moves
This strategy works well in trending markets like Nifty 50 and Sensex.
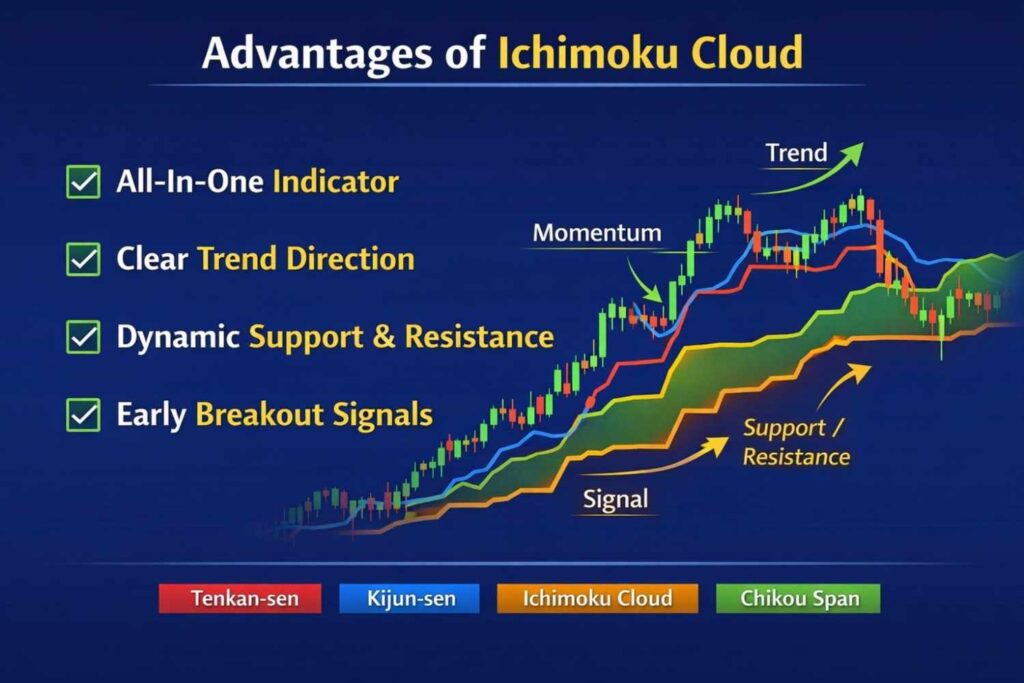
Advantages of Ichimoku Cloud
- All-in-one indicator
- Clear trend direction
- Dynamic support/resistance
- Early breakout signals
- Works on all timeframes
Limitations
- Looks complicated for beginners
- Not effective in sideways markets
- Needs confirmation for higher accuracy
Best Timeframe for Ichimoku
- Intraday traders → 15-min or 1-hour chart
- Swing traders → Daily chart
- Long-term investors → Weekly chart
Higher timeframe = stronger signal reliability.
Combine Ichimoku with Other Indicators
Smart traders never rely on one indicator only.
They combine Ichimoku with:
Because probability increases when multiple indicators confirm the same signal.
You can read our detailed post on combining multiple indicators for high-probability setups.
Final Thoughts
Ichimoku Cloud is truly an all-in-one trend indicator. It shows trend direction, momentum, support, resistance, and entry signals in one glance.
If you master:
- Cloud position
- Tenkan-Kijun crossover
- Chikou confirmation
You can significantly improve your trading decisions.
However, remember:
No indicator guarantees 100% accuracy.
Risk management is always more important than signals.
Pro Tip for Serious Traders
Professional traders use Ichimoku as a trend filter, not a blind entry tool.
They combine it with momentum indicators and volume analysis to increase probability and reduce false signals.
Because in trading, confluence = confidence.
Frequently Asked Questions (FAQ)
Which market is best for Ichimoku?
It works well in trending markets like stocks, forex, and crypto.
What is the most important line?
Kijun-sen is considered very important as it acts like strong support/resistance.
Can Ichimoku be used alone?
Yes, but combining it with RSI or Volume increases accuracy.
What does cloud thickness mean?
Thick cloud = strong support/resistance
Thin cloud = weak zone