In technical analysis, timing is everything. Buying too early or selling too late can turn a good trade into a bad one. That’s where MACD (Moving Average Convergence Divergence) comes in.
MACD is one of the most trusted momentum indicators used by traders to identify trend direction, strength, and possible reversals—all in one simple chart.
Let’s break it down step by step 👇
What is MACD?
MACD (Moving Average Convergence Divergence) is a trend-following momentum indicator that shows the relationship between two moving averages of a price.
📌 It helps traders answer three key questions:
- Is the trend bullish or bearish?
- Is the momentum increasing or decreasing?
- Is a trend reversal likely?
MACD Formula (Simple Explanation)🧮
MACD is calculated using three components:
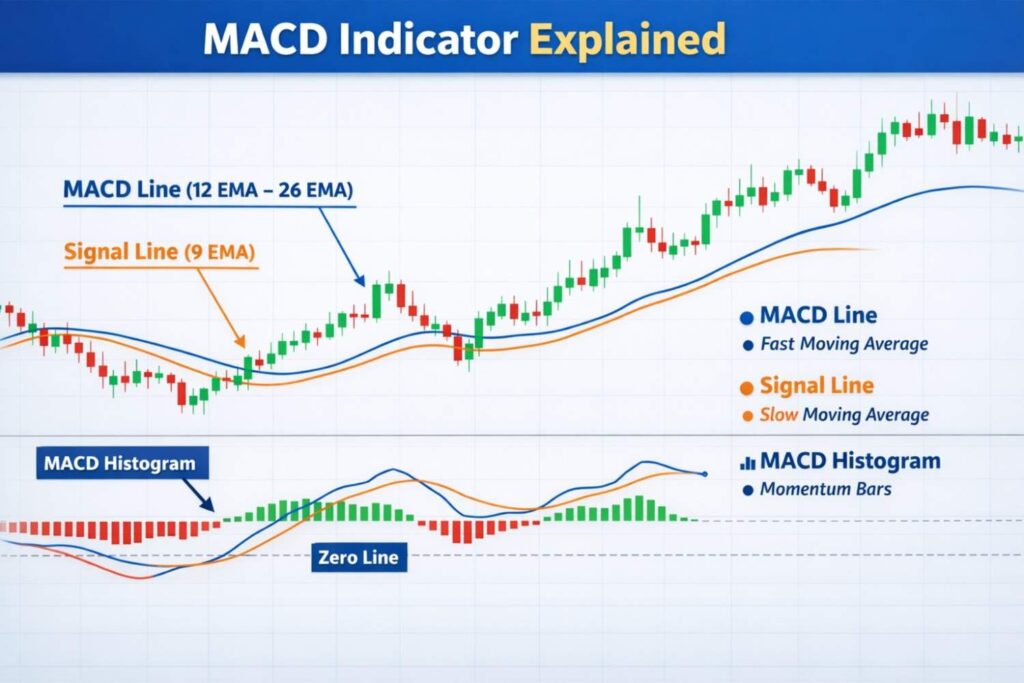
MACD Line = 12 EMA – 26 EMA
Signal Line = 9 EMA of MACD Line
Histogram = MACD Line – Signal Line
👉 Don’t worry about calculations—most charting platforms like TradingView, Zerodha Kite, MetaTrader calculate it automatically.
Components of MACD Indicator 📈
1️⃣ MACD Line (🔵)
- Shows short-term momentum
- Reacts faster to price changes
2️⃣ Signal Line (🟠)
- A moving average of MACD
- Used to identify buy/sell signals
3️⃣ Histogram (📊)
- Shows the distance between MACD & Signal Line
- Helps spot momentum strength & weakening
MACD Trading Signals Explained 🔁
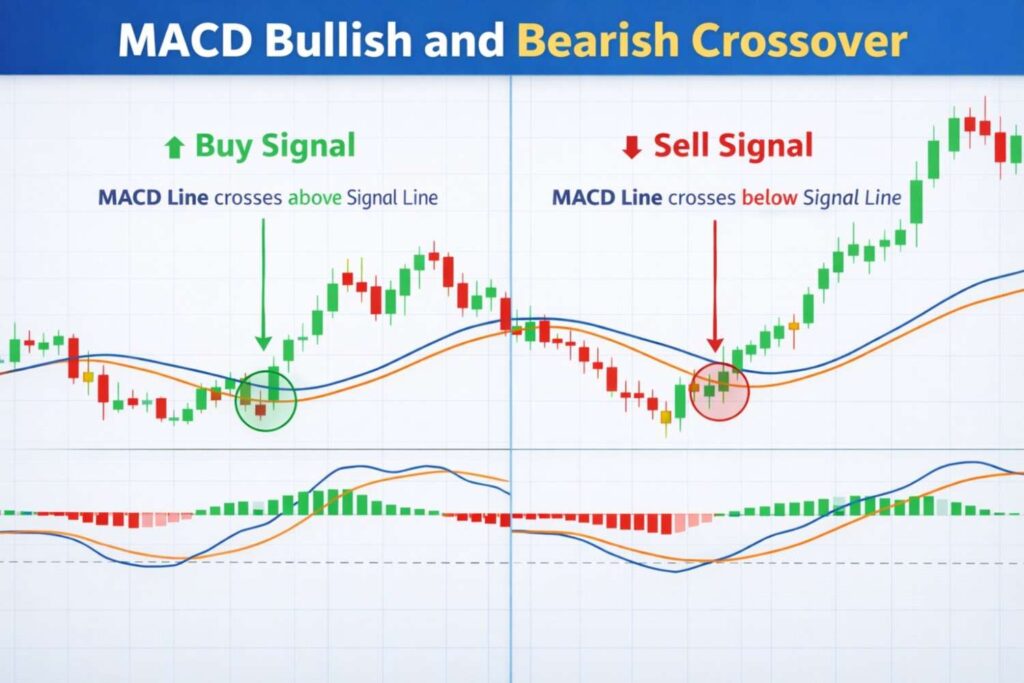
1. MACD Bullish Crossover (Buy Signal 📈)
🔹 When MACD Line crosses above Signal Line
🔹 Indicates increasing bullish momentum
Best used when:
- Price is above support
- Overall trend is sideways or turning bullish
2. MACD Bearish Crossover (Sell Signal 📉)
🔹 When MACD Line crosses below Signal Line
🔹 Indicates increasing bearish momentum
Best used when:
- Price is near resistance
- Market shows weakness
3. MACD Zero Line Crossover
- Above Zero Line (0) → Bullish trend
- Below Zero Line (0) → Bearish trend
Zero line acts like a trend filter.
Real-Time Example (Indian Stock Market)
Example: RELIANCE (Daily Chart)
- MACD Line crosses above Signal Line
- Histogram turns positive
- Price breaks previous resistance
Result: Stock rallies for next few sessions
Traders who entered after confirmation enjoyed a low-risk momentum trade
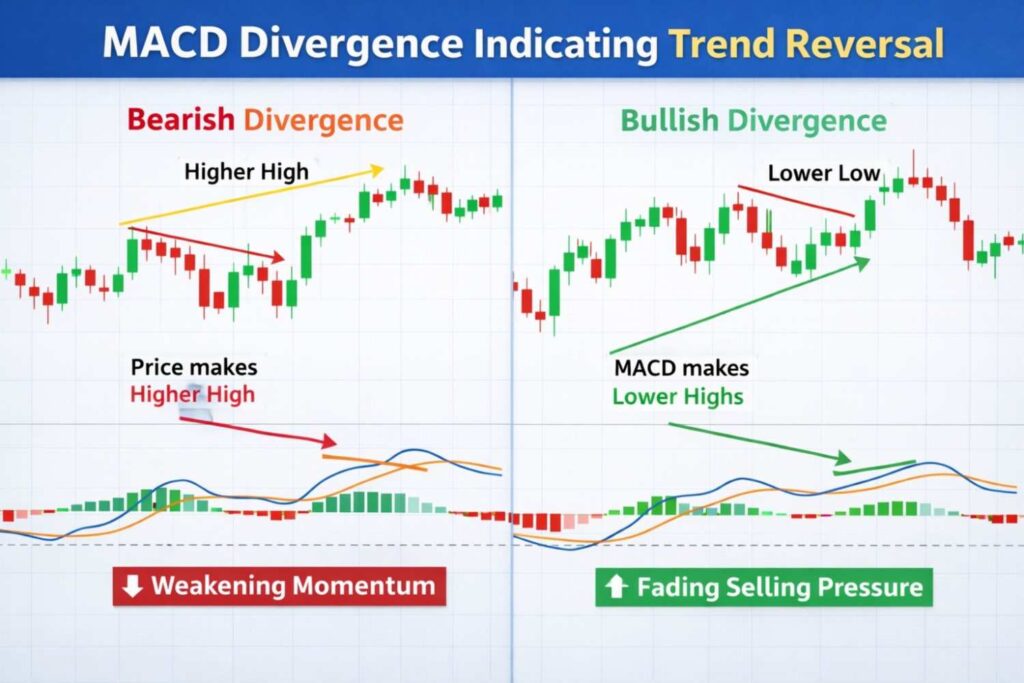
MACD Divergence – Early Trend Reversal Signal
🔴 Bearish Divergence
- Price makes higher high
- MACD makes lower high
⚠️ Indicates weakening momentum → possible fall
🟢 Bullish Divergence
- Price makes lower low
- MACD makes higher low
⚠️ Indicates selling pressure is fading → possible rise
Best Timeframes for MACD
| Trading Style | Timeframe |
|---|---|
| Intraday | 5m, 15m |
| Swing Trading | 1H, 4H |
| Positional | Daily, Weekly |
Higher timeframes = more reliable signals
Common Mistakes While Using MACD
🚫 Using MACD in choppy sideways markets
🚫 Taking trades without trend confirmation
🚫 Ignoring support & resistance
🚫 Overtrading on every crossover
MACD + Other Indicators (Best Combo) 🔗
For higher accuracy, combine MACD with:
- RSI (Overbought/Oversold confirmation)
- Support & Resistance
- Moving Averages (50 & 200 EMA)
- Volume Analysis
Final Thoughts
MACD is a powerful yet simple indicator that helps traders understand momentum, trend direction, and early reversals. When used with patience and proper confirmation, it can significantly improve trade timing.
Remember:
Indicators don’t make money—discipline and risk management do.
Frequently Asked Questions (FAQ)
Can MACD predict exact reversals?
No indicator is perfect. MACD gives probability signals, not guarantees.
Is MACD better than RSI?
They serve different purposes:
MACD → Trend & Momentum
RSI → Overbought/Oversold
Best results come from using both together.
Does MACD work in intraday trading?
Yes, but works best when combined with price action & volume.