When it comes to technical analysis, very few indicators are as powerful, simple, and widely used as Moving Averages (SMA & EMA).
Whether you are a beginner trader, long-term investor, or market analyst, understanding SMA and EMA can dramatically improve how you read market trends. https://www.investopedia.com/
🔍 What Is a Moving Average?
A Moving Average (MA) smooths out price data by creating a constantly updated average price over a specific time period.
📌 Simple meaning:
It helps you see the overall trend by removing short-term price noise.
Why traders love it ❤️
✔ Identifies trend direction
✔ Acts as support & resistance
✔ Helps with entry & exit points
✔ Works in stocks, crypto, forex, and indices
📊 Types of Moving Averages
There are many types, but the two most important are:
1️⃣ Simple Moving Average (SMA)
2️⃣ Exponential Moving Average (EMA)
Let’s understand them one by one 👇
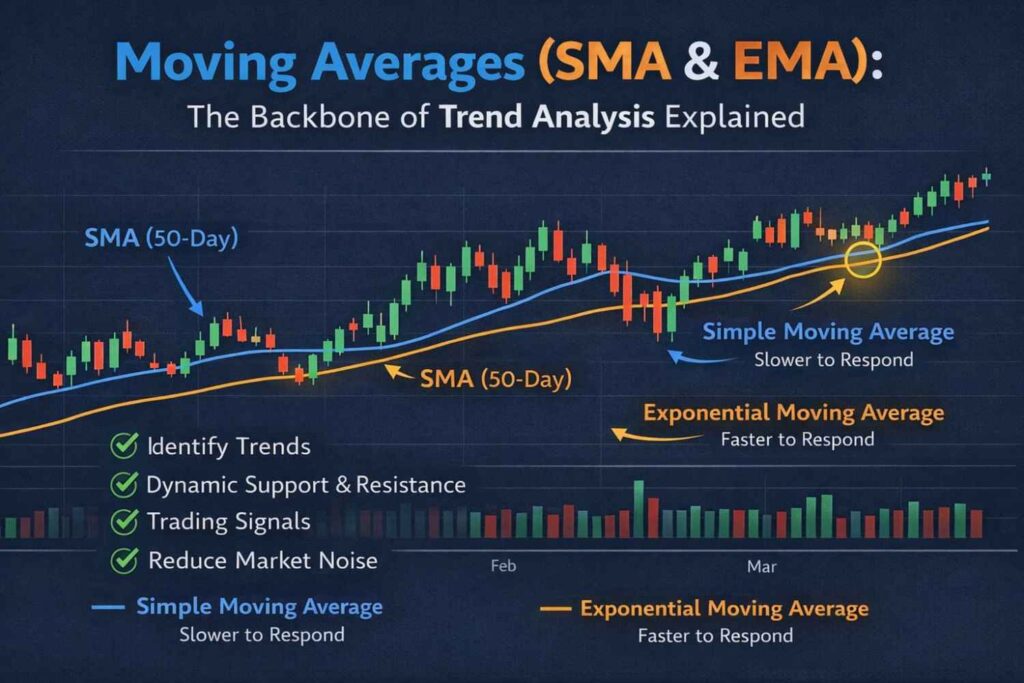
📐 Simple Moving Average (SMA)
What is SMA?
SMA calculates the average price over a specific number of periods.
📌 Formula:
SMA = (Sum of Closing Prices ÷ Number of Periods)
📊 Example
Assume NIFTY closing prices for 5 days:
| Day | Price |
|---|---|
| Day 1 | 22,000 |
| Day 2 | 22,100 |
| Day 3 | 22,050 |
| Day 4 | 22,200 |
| Day 5 | 22,150 |
👉 5-Day SMA = (22,000 + 22,100 + 22,050 + 22,200 + 22,150) ÷ 5 = 22,100
📌 This value moves forward daily as new prices are added.
⭐ Key Features of SMA
✔ Easy to calculate
✔ Best for long-term trends
✔ Reduces market noise
❌ Reacts slowly to sudden price changes
⚡ Exponential Moving Average (EMA)
What is EMA?
EMA gives more weight to recent prices, making it faster and more responsive.
📌 Simple explanation:
EMA reacts quicker when the market changes direction.
📊 Example (Stock Market)
Let’s say Reliance Industries suddenly breaks out after news.
🔹 50-Day SMA reacts slowly
🔹 50-Day EMA rises faster and signals trend change earlier
👉 This is why short-term traders prefer EMA.
⭐ Key Features of EMA
✔ Faster response to price action
✔ Ideal for short-term trading
✔ Better for volatile markets
❌ Can give false signals in sideways markets
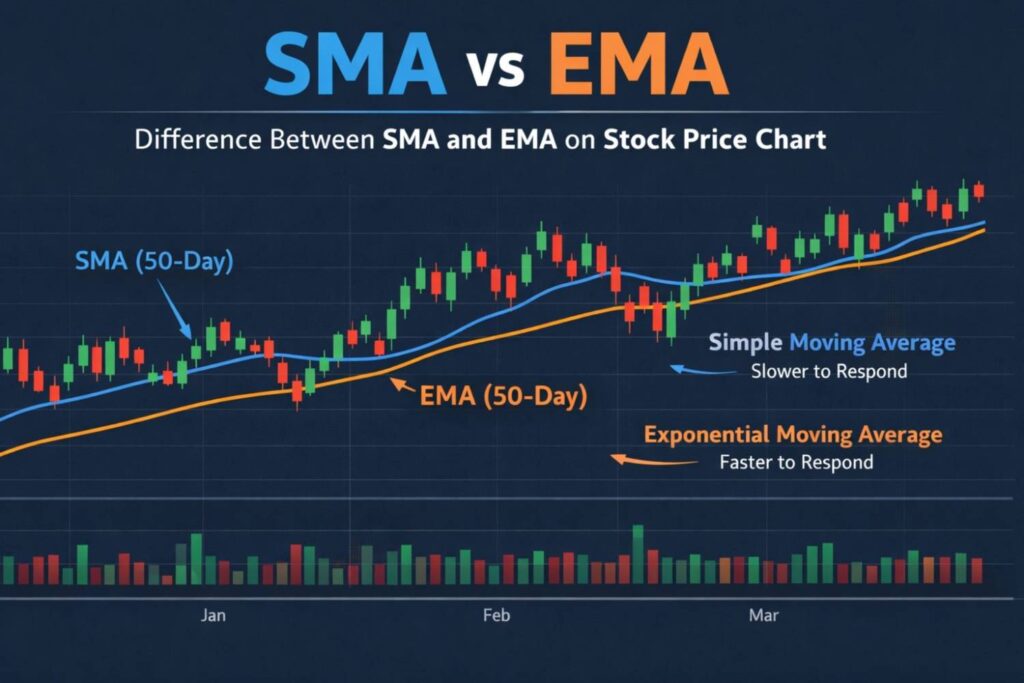
🔄 SMA vs EMA – Quick Comparison
| Feature | SMA | EMA |
|---|---|---|
| Speed | Slow | Fast |
| Weightage | Equal | More on recent data |
| Best For | Long-term investors | Short-term traders |
| Noise Handling | Better | Slightly noisy |
📌 How Moving Averages Are Used in Trading
1️⃣ Trend Identification 🔍
✔ Price above MA → Uptrend 📈
✔ Price below MA → Downtrend 📉
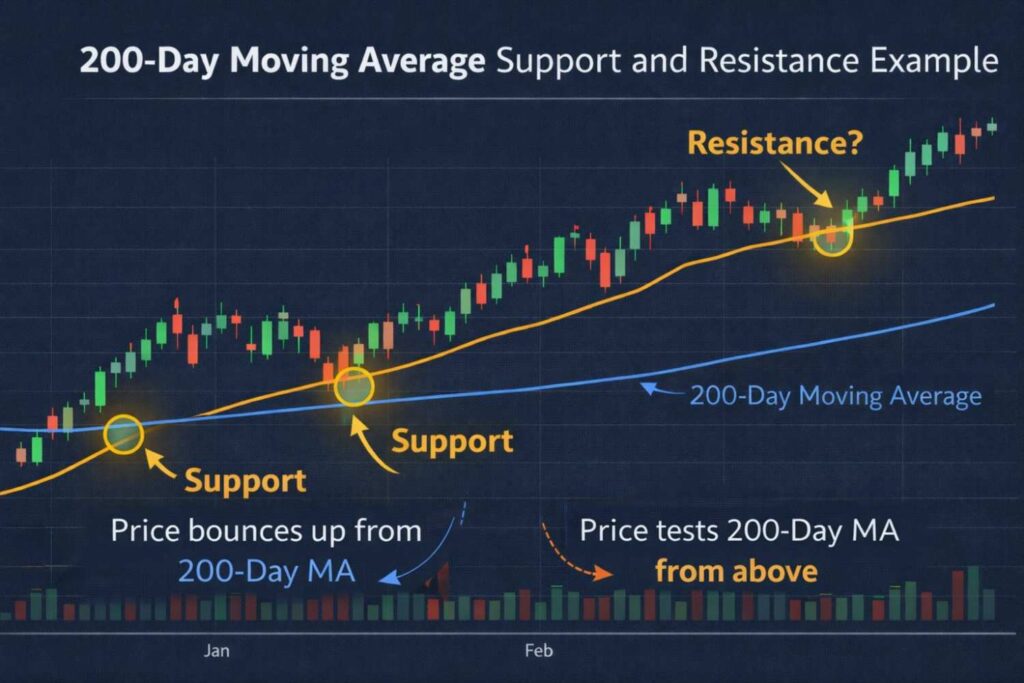
2️⃣ Support & Resistance 🧱
Moving averages often act as dynamic support and resistance.
📌 Example:
- 200-Day SMA acting as strong support for Sensex
- Price bouncing multiple times from EMA → bullish sign ✔
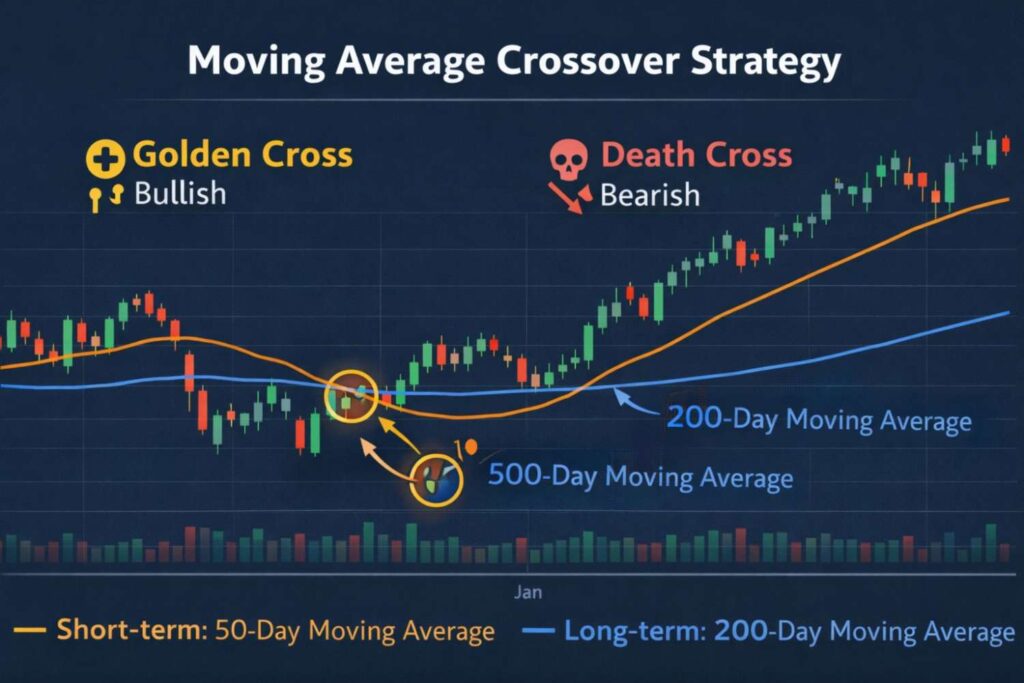
3️⃣ Moving Average Crossover Strategy 🔄
One of the most popular strategies worldwide.
📈 Golden Cross
✔ Short-term MA crosses above long-term MA
✔ Indicates strong bullish trend
📉 Death Cross
✔ Short-term MA crosses below long-term MA
✔ Indicates bearish trend
🧠 Pro Tips for Better Results
✔ Use EMA for fast markets
✔ Use SMA for clean trend confirmation
✔ Avoid over-trading in sideways markets
✔ Combine MA with price action
🏁 Final Thoughts
Moving Averages (SMA & EMA) are truly the backbone of trend analysis.
They don’t predict the future—but they help you trade with the trend, and in trading:
“The trend is your friend.” 📈
Mastering moving averages can dramatically improve your decision-making, confidence, and consistency in the market.
Frequently Asked Questions (FAQ)
Is RSI good for beginner
Yes 👍 RSI is one of the best indicators for beginners because it’s visual and easy to interpret.
Can RSI be used alone?
It can be, but results improve when RSI is combined with:
- Support & resistance
- Moving averages
- Trendlines
Which timeframe is best for RSI?
- Intraday: 5‑min, 15‑min
- Swing trading: Daily
- Investing: Weekly
Does RSI work in crypto and forex?
Yes ✔️ RSI works across:
- Stocks
- Crypto
- Forex
- Commodities