Introduction: Why Volume Tells the Real Story
Many traders focus only on price. But experienced traders know one simple truth — price shows what happened, volume shows why it happened.
Have you ever noticed a stock quietly rising before a big breakout? Or falling slowly before a sharp crash? That hidden movement is often driven by institutional money — and one of the best tools to track it is On-Balance Volume (OBV).
In this guide, I’ll explain OBV in simple language, show you how it works, and walk you through a real-time example so you can start using it confidently.
What is On-Balance Volume (OBV)?
Joseph Granville introduced OBV in the 1960s. His idea was simple:
“Volume precedes price.”
OBV is a momentum indicator that combines price and volume to show whether money is flowing into or out of a stock.
- If volume increases on up days → Buying pressure
- If volume increases on down days → Selling pressure
OBV doesn’t predict the future. It reveals what big players may already be doing.
How OBV Works (Simple Explanation)
OBV follows a cumulative formula:
OBV=PreviousOBV+Volume(ifClose>PreviousClose)\nOBV=PreviousOBV−Volume(ifClose<PreviousClose)OBV = Previous OBV + Volume (if Close > Previous Close)\nOBV = Previous OBV – Volume (if Close < Previous Close)OBV=PreviousOBV+Volume(ifClose>PreviousClose)\nOBV=PreviousOBV−Volume(ifClose<PreviousClose)
In simple words:
- If today’s closing price is higher than yesterday → add volume
- If today’s closing price is lower → subtract volume
- If price is unchanged → OBV remains the same
Over time, this creates a line that reflects buying and selling pressure.
The absolute number doesn’t matter. The trend of the OBV line is what traders watch.
Why OBV is Called “Smart Money Tracker”
Retail traders usually react late. Institutions move early.
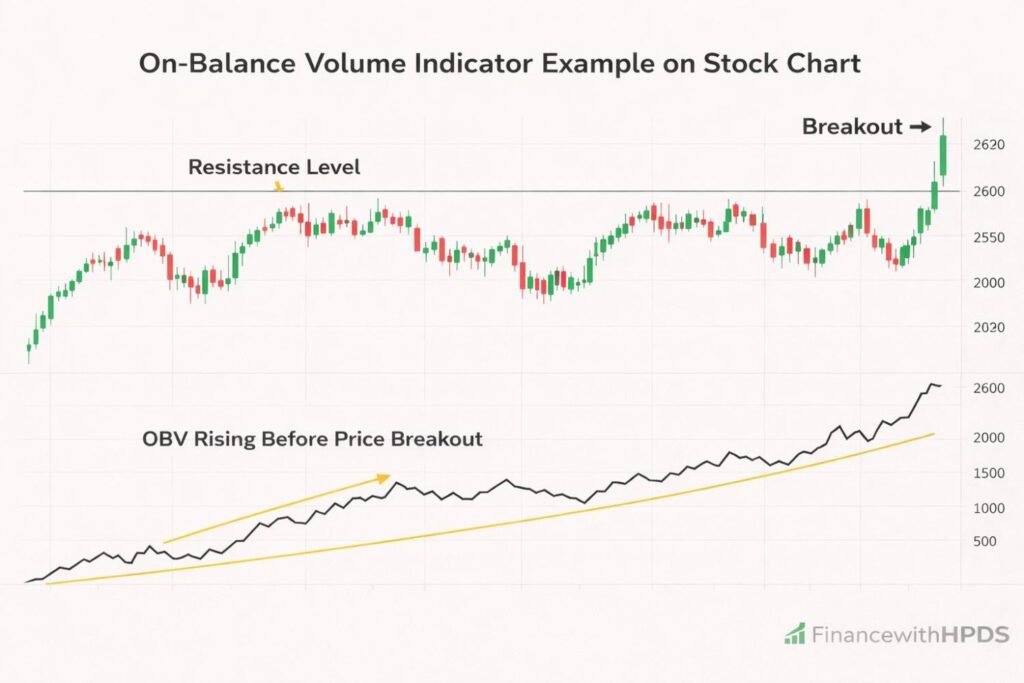
Before a breakout, smart money often accumulates shares quietly. Price may not move much, but volume increases. OBV starts rising before price.
Similarly, before a fall, big players may distribute shares. OBV starts falling even if price looks stable.
This early signal makes OBV powerful.
Real-Time Example: Reliance Industries
Let’s take a practical example from Reliance Industries.
Suppose Reliance is trading sideways between ₹2,400 and ₹2,450 for several days.
You observe:
- Price is not breaking out
- OBV is steadily rising
What does this mean?
It suggests accumulation. Buyers are active even though price hasn’t moved significantly.
A few days later, Reliance breaks above ₹2,450 with strong momentum.
OBV already hinted at the breakout before price confirmed it.
That’s smart money behavior.
How to Use OBV in Trading
1. Trend Confirmation
If price is making higher highs and OBV is also making higher highs → Uptrend is strong.
If price rises but OBV stays flat → Weak momentum.
Always look for alignment between price and OBV.
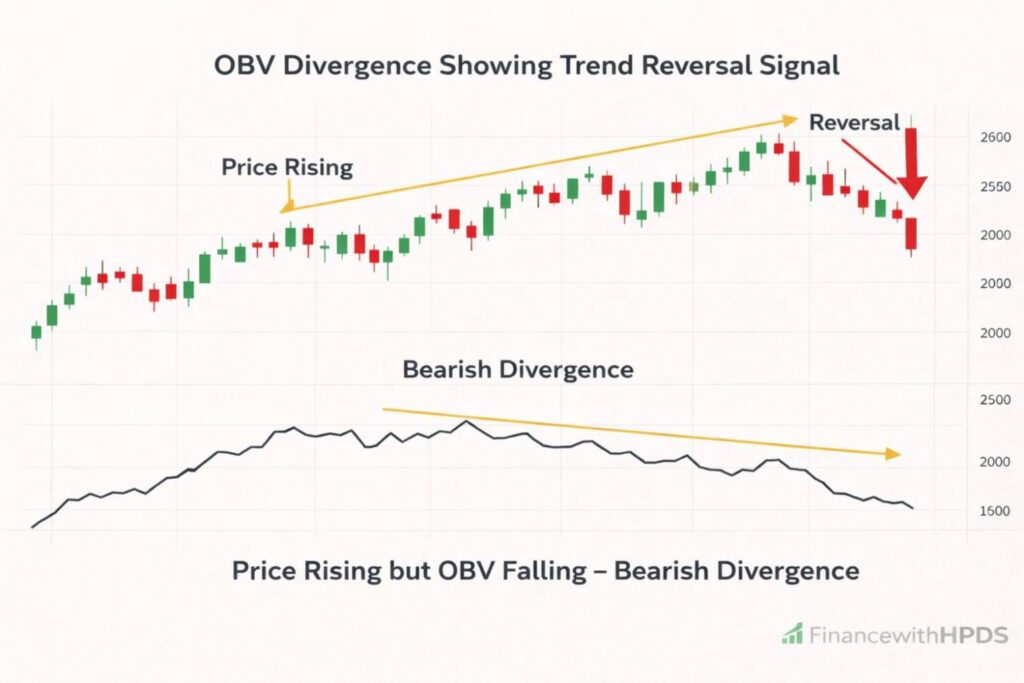
2. OBV Divergence (Powerful Signal)
Divergence is where OBV shines.
- Price makes higher highs
- OBV makes lower highs
This suggests weakening buying pressure. A reversal may come.
Similarly:
- Price makes lower lows
- OBV makes higher lows
This shows hidden accumulation.
Divergence doesn’t mean immediate reversal — but it’s an early warning.
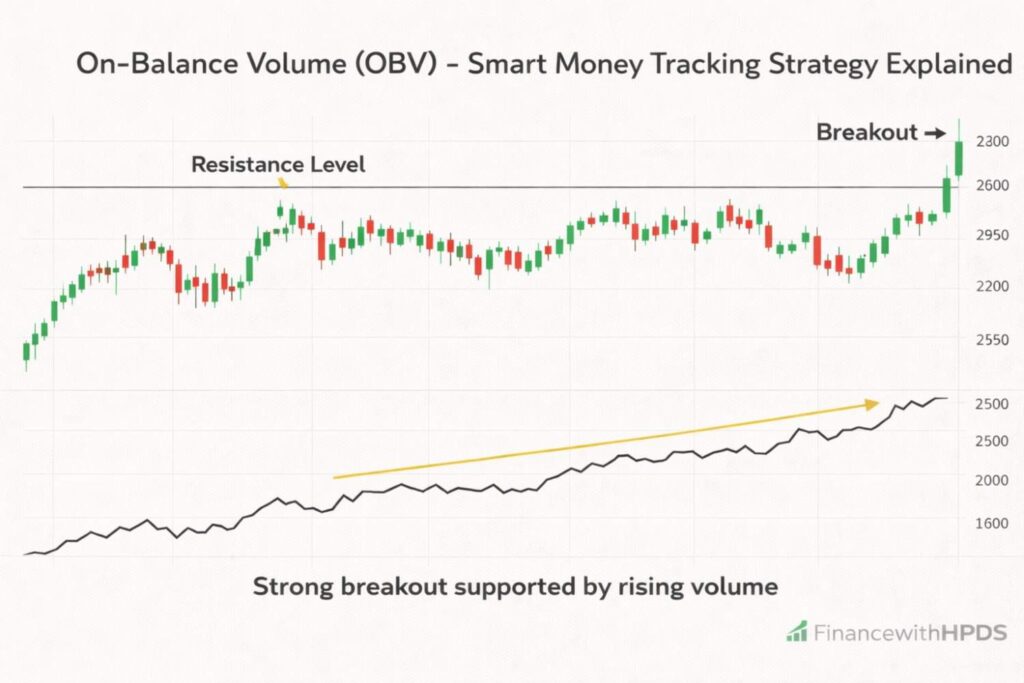
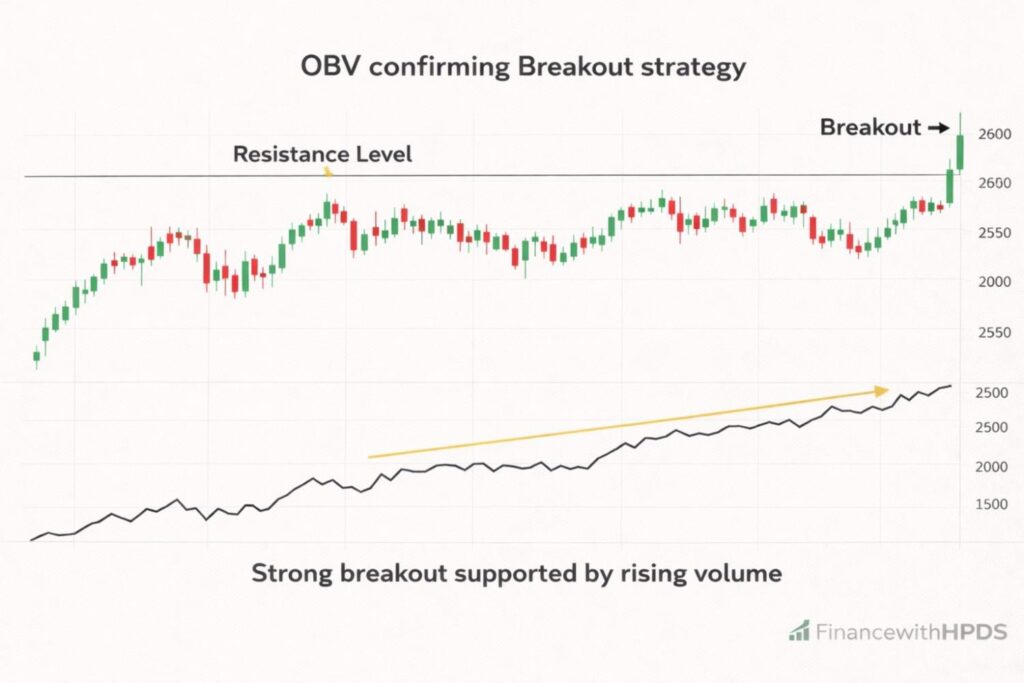
3. Breakout Confirmation
Before entering breakout trades:
- Check if OBV is already trending upward.
- If OBV breaks resistance before price → Strong signal.
This reduces false breakouts.
OBV Trading Strategy (Step-by-Step)
Here’s a simple strategy beginners can follow:
Step 1: Identify a consolidation zone
Step 2: Observe OBV direction
Step 3: Enter when price breaks with OBV confirmation
Step 4: Place stop-loss below recent swing low This strategy works well in trending markets.
Common Mistakes Traders Make
- Using OBV without checking price structure
- Ignoring divergence signals
- Trading in sideways markets
- Entering without volume confirmation
Remember, OBV confirms — it doesn’t predict blindly.
Combining OBV with Other Indicators
Smart traders never rely on just one indicator. They combine tools to increase probability.
For example:
- OBV + RSI → Momentum + Volume confirmation
- OBV + Moving Average → Trend + Volume strength
- OBV + Breakout strategy → Strong entry timing
When volume supports price, trades become more reliable.
Final Thoughts: Volume Never Lies
Price can mislead you. News can confuse you. Emotions can trap you.
But volume reveals participation.
On-Balance Volume is not magic. It is a tool that helps you see what large players might be doing behind the scenes.
Use it with discipline. Combine it with price action. Manage risk properly.
Because in trading, success doesn’t come from predicting the future — it comes from following the flow of smart money with patience and consistency.
Trade smart. Trade disciplined. Let probability work in your favor.
Frequently Asked Questions (FAQ)
Does OBV work in all market conditions?
It works best in trending markets. In sideways markets, signals may be weaker.
Can beginners use OBV?
Absolutely. OBV is one of the simplest volume indicators available.
What timeframe is best for OBV?
Daily timeframe is most reliable. Swing traders prefer 4-hour or daily charts.
Is OBV better than other volume indicators?
OBV is simple and effective, but no indicator is “best.” It depends on your strategy.
For More Updates About Stock Market Click Here
For More Updates About Income Tax Click Here
For More Updates About Personal Finance Click Here
For More Updates About Government Scheme Click Here