If you’ve ever wondered “Is this stock too expensive right now?” or “Has the selling gone too far?” — the Relative Strength Index (RSI) is one of the simplest and most powerful tools to answer that.
Used by traders and investors worldwide, RSI helps spot overbought and oversold zones, often before price reversals happen.
What is Relative Strength Index (RSI)?
The Relative Strength Index (RSI) is a momentum oscillator developed by J. Welles Wilder. It measures the speed and strength of price movements on a scale of 0 to 100.
In simple words: RSI tells us whether buyers or sellers are stronger right now.
RSI Formula (Simple Explanation) 📊
RSI is calculated using this formula:
RSI = 100 − [100 ÷ (1 + RS)]
Where:
- RS = Average Gain ÷ Average Loss (usually over 14 periods)
💡 Don’t worry — you don’t need to calculate this manually. Trading platforms like TradingView, Zerodha Kite, or MetaTrader do it automatically.
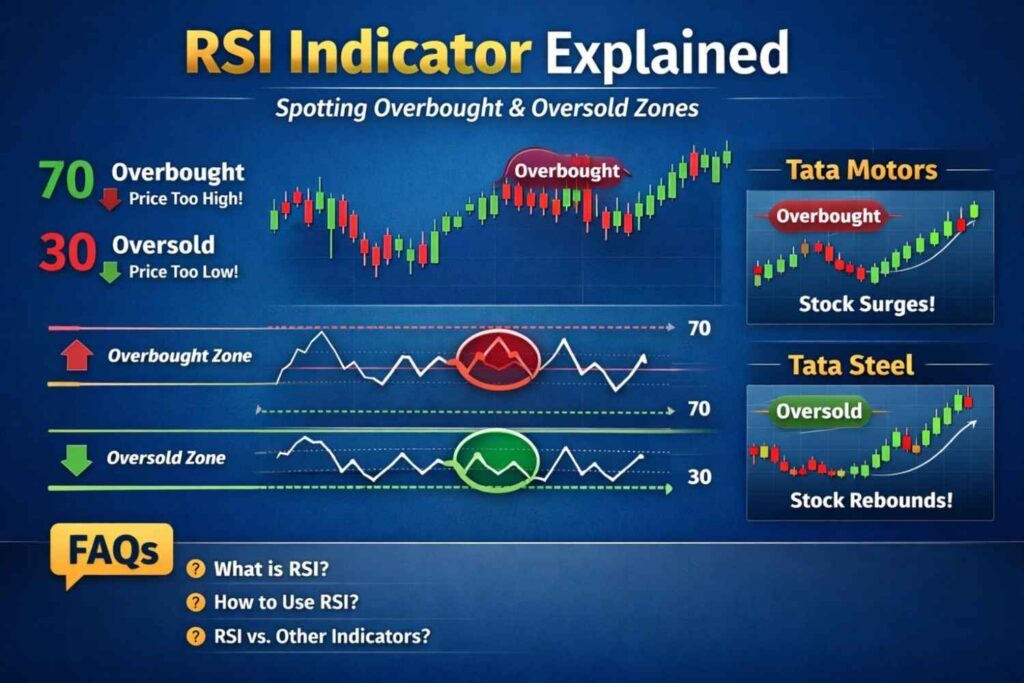
Understanding RSI Levels (With Symbols) ⚖️
| RSI Level | Meaning | Symbol |
|---|---|---|
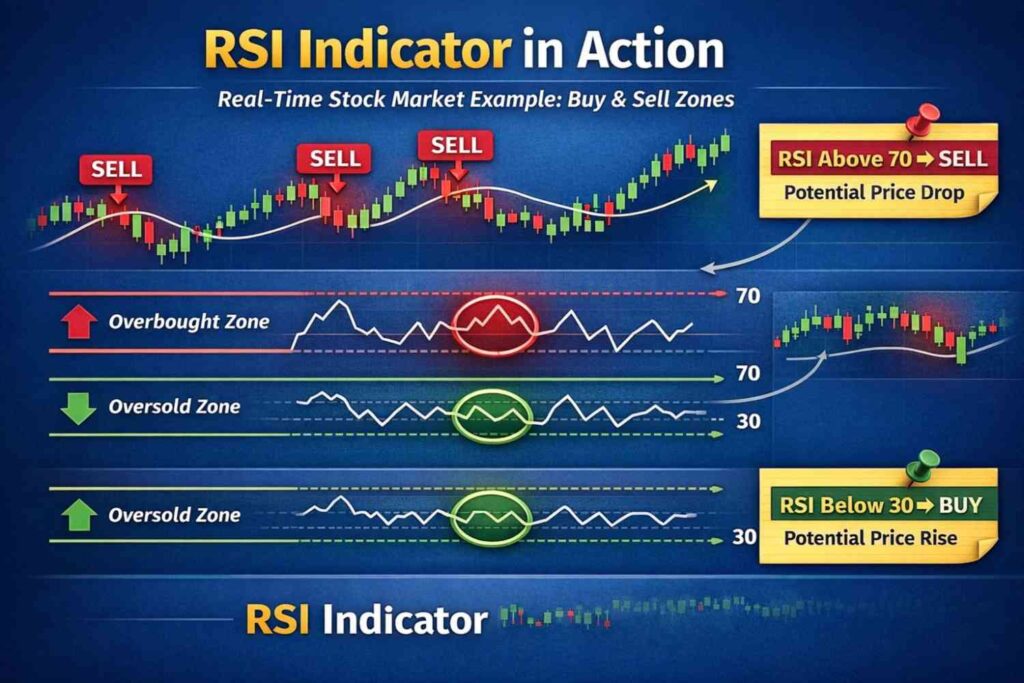
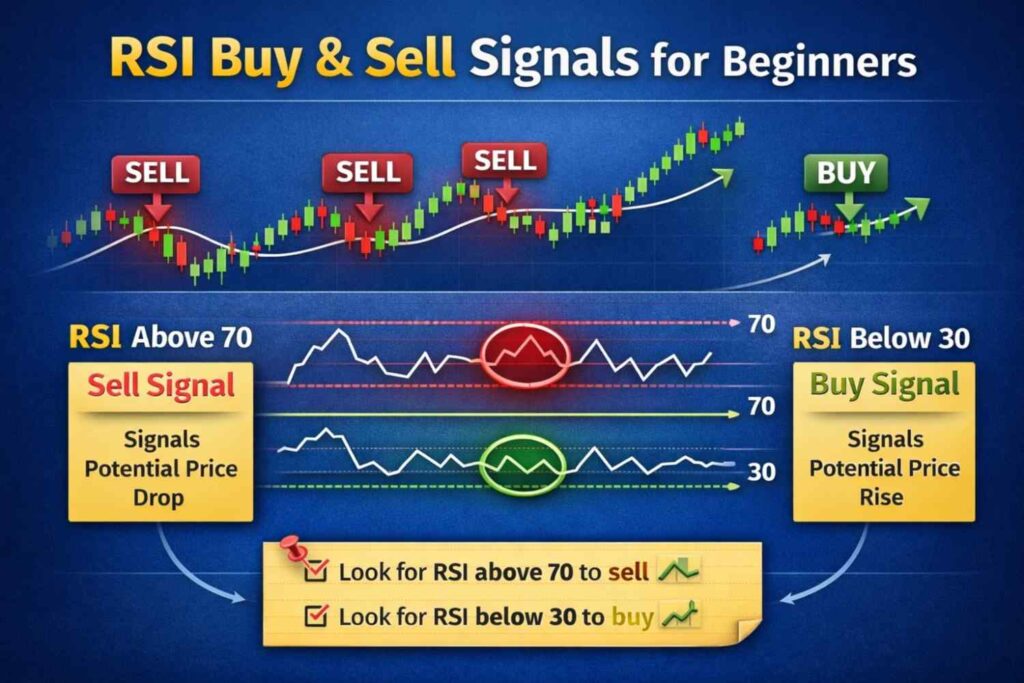
| Above 70 | Overbought | 🔴 |
| Below 30 | Oversold | 🟢 |
| Around 50 | Neutral / No Trend | ⚪ |
🔴 RSI Above 70 – Overbought Zone
- Price has moved up too fast
- Buying pressure is high
- Possible profit booking or pullback
🟢 RSI Below 30 – Oversold Zone
- Heavy selling pressure
- Price may be undervalued short‑term
- Possible bounce or reversal
Real-Time Example of RSI (Indian Market)
Example 1: RSI Overbought 📉
Stock: Reliance Industries (NSE: RELIANCE)
- RSI(14) = 78
- Stock rallied sharply in last few sessions
🔍 Interpretation: Buyers may be exhausted. Smart traders wait for RSI to cool down or price confirmation before entering.
Example 2: RSI Oversold 📈
Stock: Tata Motors (NSE: TATAMOTORS)
- RSI(14) = 26
- Strong selling due to market panic
🔍 Interpretation: Selling may be overdone. A short‑term bounce is possible if price supports.
⚠️ Important: RSI works best when combined with support, resistance, or trend analysis.
RSI in Trending vs Sideways Markets 🧠
📈 In Strong Uptrend
- RSI often stays between 40–80
- Overbought does not always mean sell
📉 In Strong Downtrend
- RSI stays between 20–60
- Oversold does not always mean buy
💡 Pro Tip: Trend first, RSI second.
Advantages of RSI
✔ Easy to understand ✔ Works in all markets ✔ Helps spot reversals early ✔ Great for timing entries & exits
Limitations of RSI
✘ False signals in strong trends ✘ Not a standalone tool
Final Thoughts 🏁
The Relative Strength Index (RSI) is a powerful yet beginner‑friendly indicator that helps traders identify overbought and oversold zones with confidence.
Used correctly — along with price action and trend analysis — RSI can significantly improve your trading decisions.
📌 Remember: RSI is a guide, not a guarantee.
Also beneficial for use another indicators to improve possibility
Frequently Asked Questions (FAQ)
Is RSI good for beginner
Yes 👍 RSI is one of the best indicators for beginners because it’s visual and easy to interpret.
Can RSI be used alone?
It can be, but results improve when RSI is combined with:
- Support & resistance
- Moving averages
- Trendlines
Which timeframe is best for RSI?
- Intraday: 5‑min, 15‑min
- Swing trading: Daily
- Investing: Weekly
Does RSI work in crypto and forex?
Yes ✔️ RSI works across:
- Stocks
- Crypto
- Forex
- Commodities