In the world of stock trading and technical analysis, timing is everything. Enter the Stochastic Oscillator—a powerful momentum indicator that helps traders identify overbought and oversold zones, spot trend reversals, and improve entry–exit timing.
Whether you are a beginner or an experienced trader, understanding this indicator can significantly improve your trading decisions.
What is the Stochastic Oscillator?
The Stochastic Oscillator is a momentum indicator developed by George Lane.
It compares a stock’s closing price to its price range over a specific period, usually 14 periods.
Instead of following price directly, it measures speed and strength of price movement, helping traders detect potential turning points before they happen.
Indicator Symbol
%K and %D lines
- %K line → Fast line (main signal)
- %D line → Moving average of %K (confirmation line)
The oscillator moves between 0 and 100.
How the Stochastic Oscillator Works
The logic is simple:
- When price closes near the high, momentum is bullish
- When price closes near the low, momentum is bearish
Key Levels to Watch
- Above 80 → Overbought zone (possible sell or pullback)
- Below 20 → Oversold zone (possible buy or bounce)
These levels help traders time market turns rather than just follow trends.
Real-Time Trading Example
Imagine a stock trading in an uptrend:
- Price starts pulling back slightly.
- Stochastic drops below 20 (oversold).
- %K crosses above %D.
- Price begins rising again.
This setup often gives a high-probability buy signal during an uptrend.
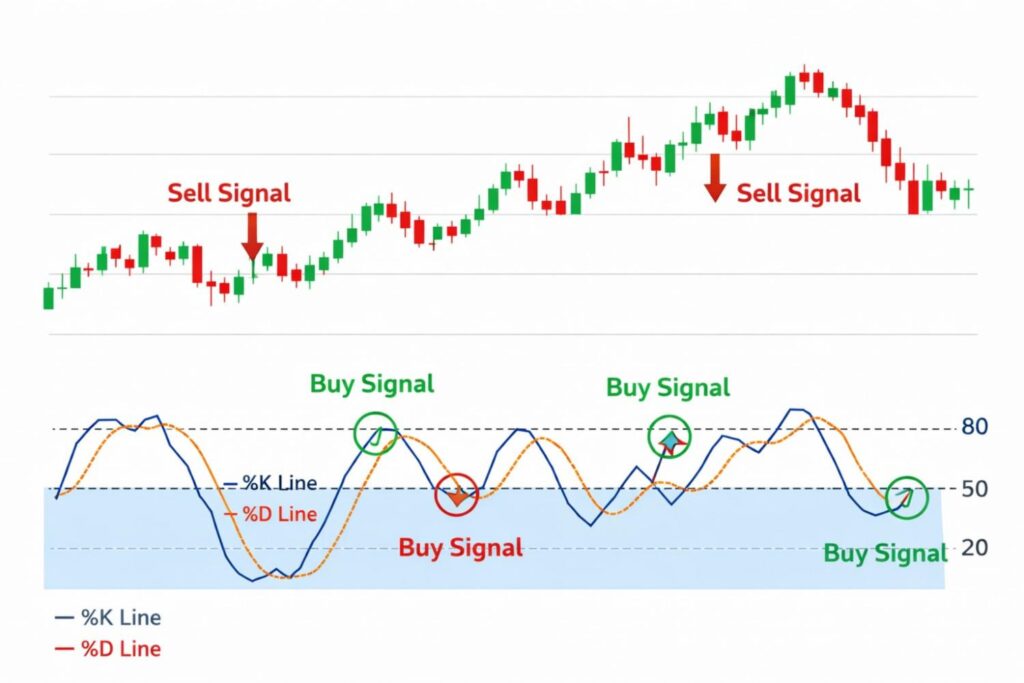
Similarly:
- If Stochastic rises above 80
- Then %K crosses below %D
→ It may signal a short-term sell opportunity.
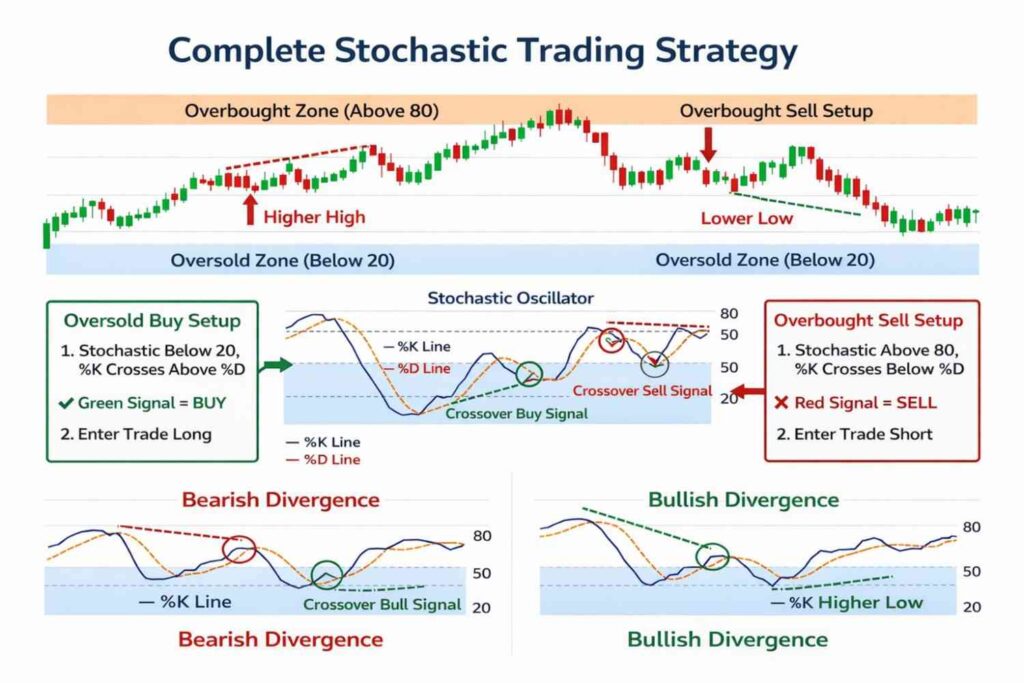
Best Stochastic Trading Strategies
1. Overbought–Oversold Reversal Strategy
- Buy when indicator moves below 20 and crosses upward
- Sell when indicator moves above 80 and crosses downward
✔ Best for range-bound markets
2. Trend Confirmation Strategy
- In uptrend → Take only oversold buy signals
- In downtrend → Take only overbought sell signals
✔ Helps avoid false signals.
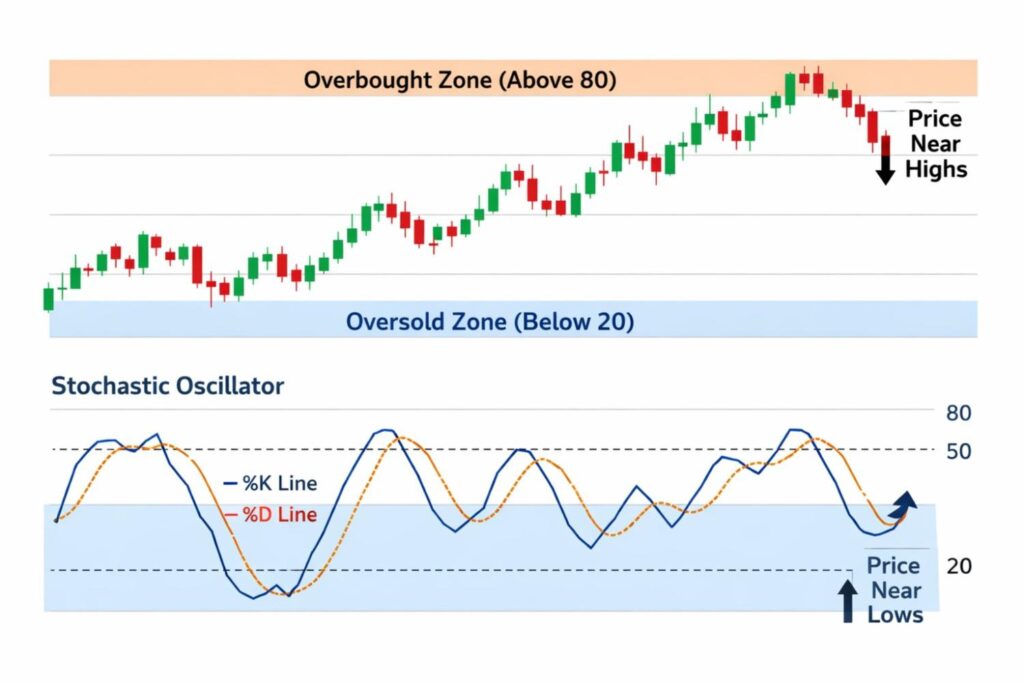
3. Stochastic Divergence Strategy
- Bullish divergence → Price makes lower low, indicator makes higher low
- Bearish divergence → Price makes higher high, indicator makes lower high
✔ Strong signal of trend reversal.
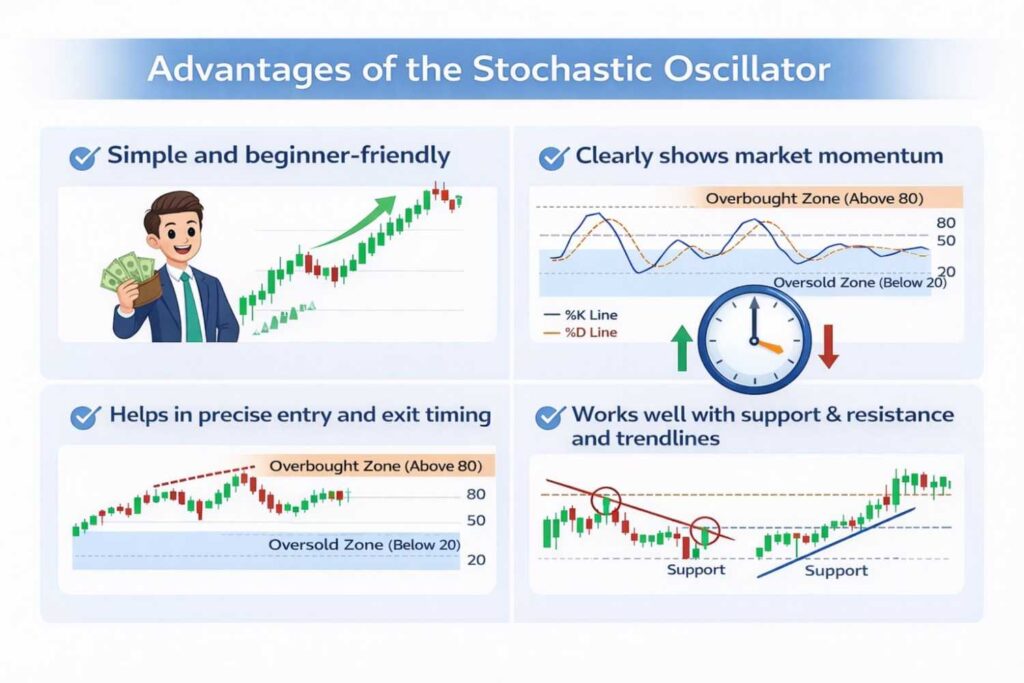
Advantages of the Stochastic Oscillator
- Simple and beginner-friendly
- Clearly shows market momentum
- Helps in precise entry and exit timing
- Works well with support & resistance and trendlines
Limitations You Should Know
- Gives false signals in strong trends
- Should not be used alone
- Works best when combined with:
Smart traders always confirm before entering a trade.
Final Thoughts
The Stochastic Oscillator is one of the most effective tools for timing market turns, spotting reversals, and improving trade precision.
However, the real power comes when you:
- Combine it with trend analysis
- Use proper risk management
- Wait for clear confirmation signals
Master this indicator, and you’ll take a big step toward smarter, more confident trading.
Frequently Asked Questions (FAQ)
What is the best setting for Stochastic?
The most common setting is 14, 3, 3, which works well for most markets.
Can Stochastic be used for intraday trading?
Absolutely. Many traders use it for scalping and intraday reversals.
Which is better: RSI or Stochastic?
Both are momentum indicators.
RSI is smoother.
Stochastic gives faster signals.
Using both together improves accuracy.
Does Stochastic work in trending markets?
Yes, but only when used with trend confirmation tools like moving averages.