Introduction
If you want to succeed in the Indian stock market, understanding technical chart patterns is extremely important. These patterns help traders and investors predict future price movements using past price behavior.
In this blog, we’ll explain 5 powerful technical chart patterns using simple language, Indian stock examples, and clear trading logic, so even beginners can understand easily. Also use specific indicator to improve our trading confirmation
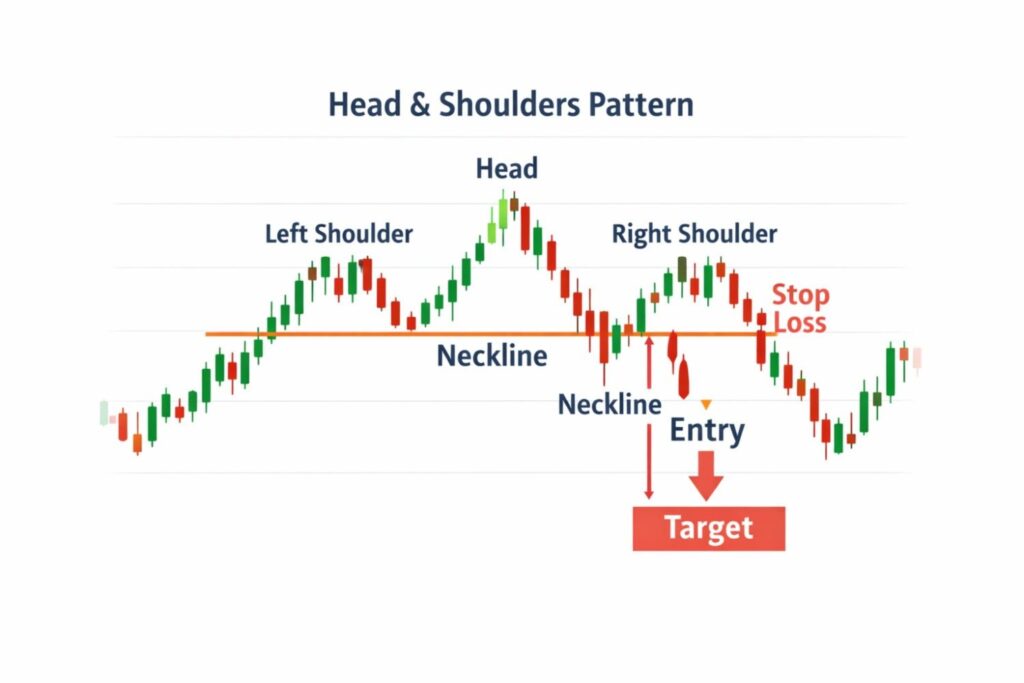
1. Head and Shoulders Pattern 🧍♂️
Meaning:
This pattern signals a trend reversal from bullish to bearish.
Structure:
- Left Shoulder
- Head (highest peak)
- Right Shoulder
How to Trade:
- Sell when price breaks the neckline
- Stop-loss above the right shoulder
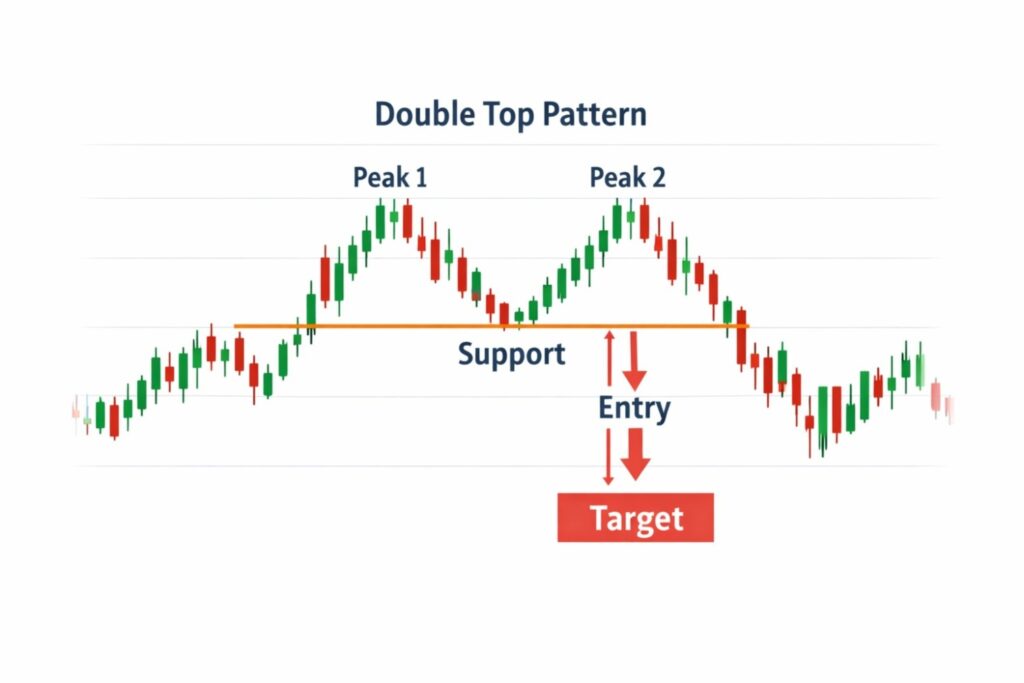
2. Double Top Pattern ⛰️⛰️
Meaning:
Indicates price exhaustion and possible downtrend.
Structure:
- Two equal highs
- Breakdown from support level
How to Trade:
- Sell after support breakdown
- Target = height of pattern
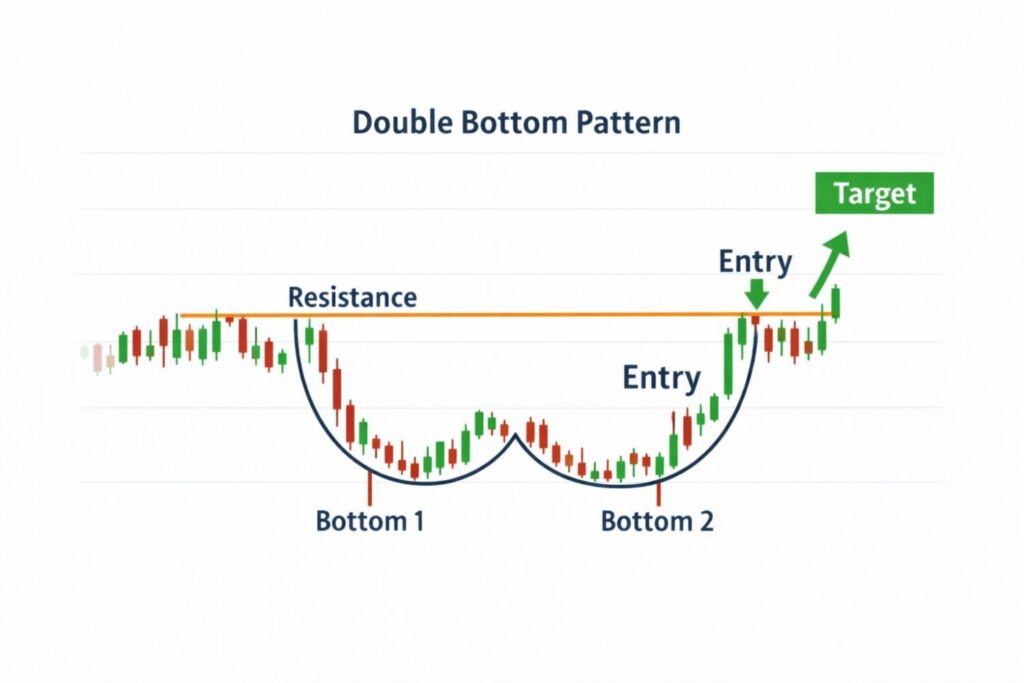
3. Double Bottom Pattern 🛡️
Meaning:
Shows strong support and potential trend reversal upward.
Structure:
- Two equal lows
- Breakout above resistance
How to Trade:
- Buy on breakout
- Stop-loss below support
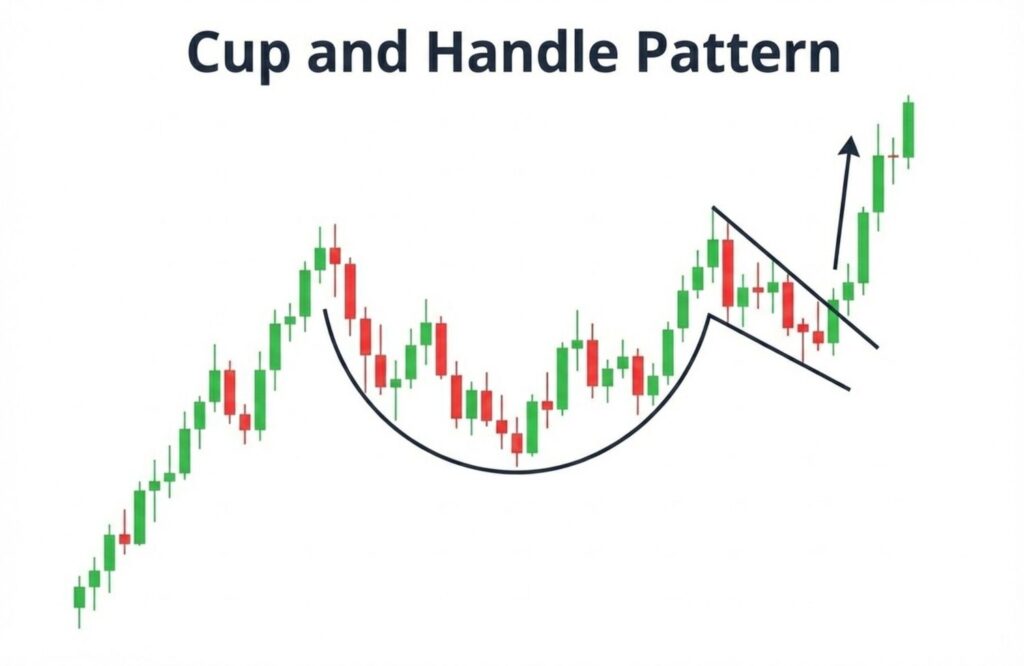
4. Cup and Handle Pattern ☕
Meaning:
A bullish continuation pattern used for long-term investing.
Structure:
- Rounded bottom (Cup)
- Small correction (Handle)
How to Trade:
- Buy on handle breakout
- Best for positional trades
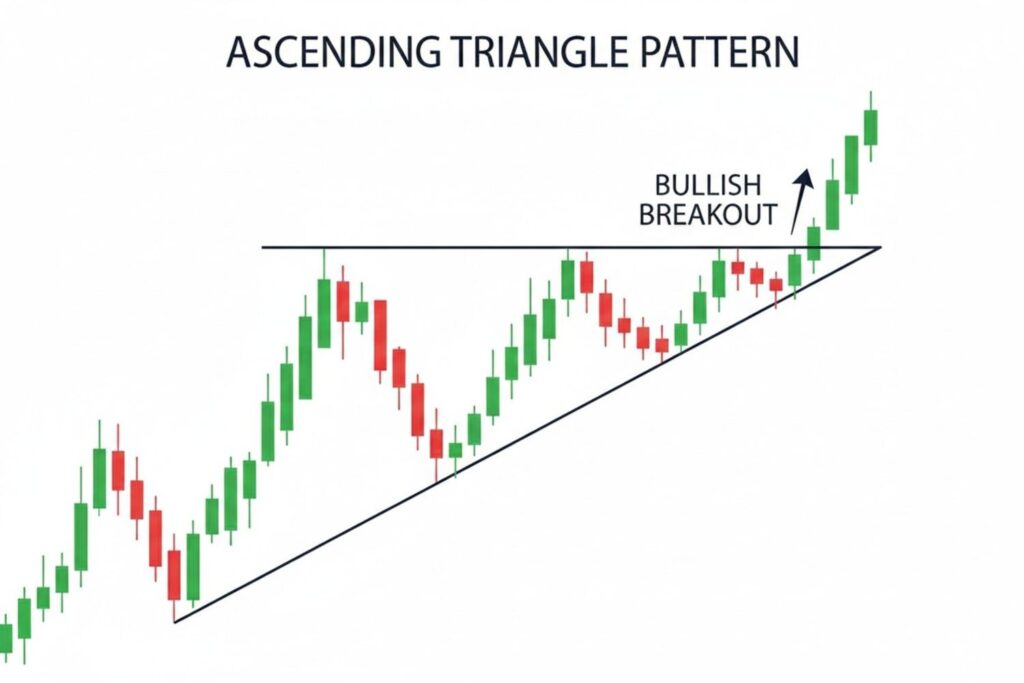
5. Ascending Triangle Pattern 🔺
Meaning:
Shows higher lows and strong resistance — bullish sign.
Structure:
- Flat resistance
- Rising support line
How to Trade:
- Buy on breakout with volume
- Stop-loss below trendline
Why Chart Patterns Matter in Stock Market?
✔ Works well in NIFTY & Bank NIFTY https://www.nseindia.com/index-tracker/NIFTY%20BANK
✔ Helps in entry & exit timing
✔ Reduces emotional trading https://share.google/2g2lVZeQbERVAxhDk
✔ Used by professional traders
Frequently Asked Questions (FAQ)
Q1. Are chart patterns reliable in Indian stocks?
Yes, when combined with volume and trend, they work very well.
Q2. Which pattern is best for beginners?
👉 Double Bottom & Cup and Handle are easiest to understand.
Q3. Can I use chart patterns for long-term investing?
Yes, especially Cup and Handle and Ascending Triangle.
Q4. Do chart patterns work in intraday trading?
Yes, but always confirm with volume and indicators.
Very valuable post
Pingback: Moving Averages (SMA & EMA): The Backbone of Trend Analysis Explained(50/200 EMA)