Introduction
Have you ever seen a stock price rising sharply but still felt unsure whether the move was real or just temporary?
That’s where volume analysis becomes powerful.
In simple words:
Price shows direction.
Volume shows strength.
When both move together, traders gain confidence that a trend is genuine.
What is Volume in Trading?
Volume means the number of shares or contracts traded during a specific time.
It tells us:
- How much interest traders have in a stock
- Whether buyers or sellers are stronger
- If a price breakout is reliable or fake
On charts, volume usually appears as vertical bars at the bottom.
Volume Symbol & How It Appears on Charts
Common Symbol
VOL or Volume
How It Looks
- Green bar → buying pressure
- Red bar → selling pressure
- Tall bar → strong participation
- Small bar → weak interest
Why Volume Confirms Price Movement ?
1. Strong Trend = High Volume
When price rises with increasing volume, it means:
✔ Buyers are confident
✔ Trend is likely to continue
But if price rises with low volume, the move may fail soon.
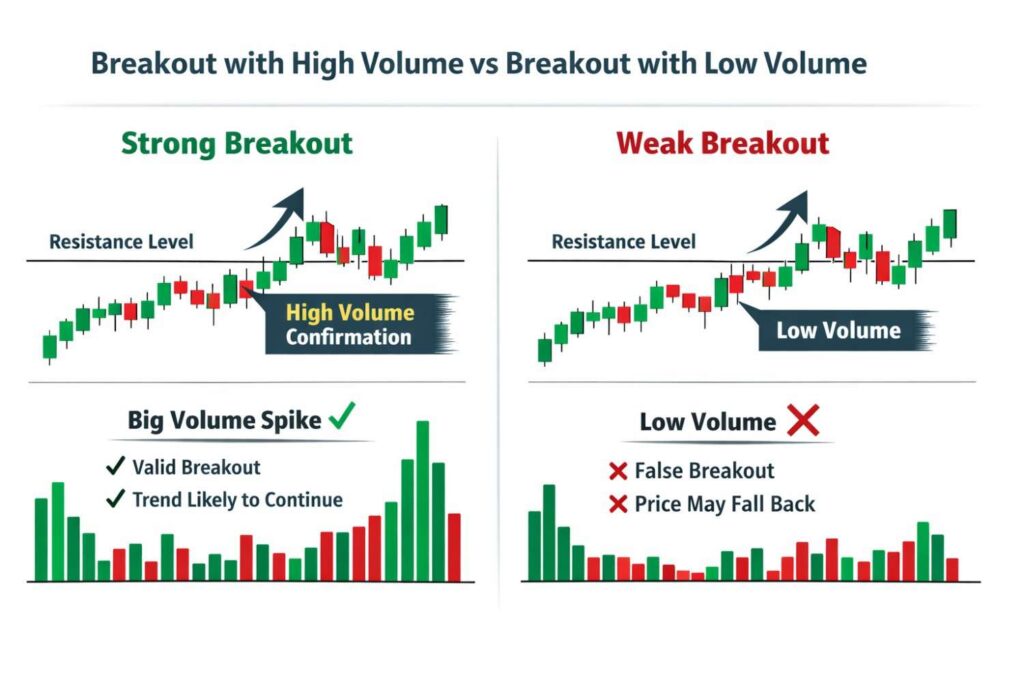
2. Breakouts Need Volume Support
A breakout above resistance is reliable only when volume spikes.
Without volume:
❌ Breakout can be false
❌ Price may fall back quickly
3. Volume Shows Trend Reversal Signals
Watch for this situation:
- Price rising
- Volume falling
This often means:
⚠ Buyers losing strength
⚠ Possible trend reversal soon
Real-Time Market Example (Simple Explanation)
Imagine Reliance Industries stock:
Scenario A – Genuine Uptrend
- Price moves from ₹2500 → ₹2600
- Volume increases each day
➡ Shows strong buying interest
➡ Uptrend likely to continue
Scenario B – Weak Uptrend
- Price rises slightly
- Volume keeps decreasing
➡ Indicates lack of confidence
➡ Price may fall again
This is why professional traders never look at price alone.
Popular Volume Indicators Traders Use
1. Volume Bars
Basic and most important tool.
2. On-Balance Volume (OBV)
Shows buying vs selling pressure over time.
3. Volume Moving Average
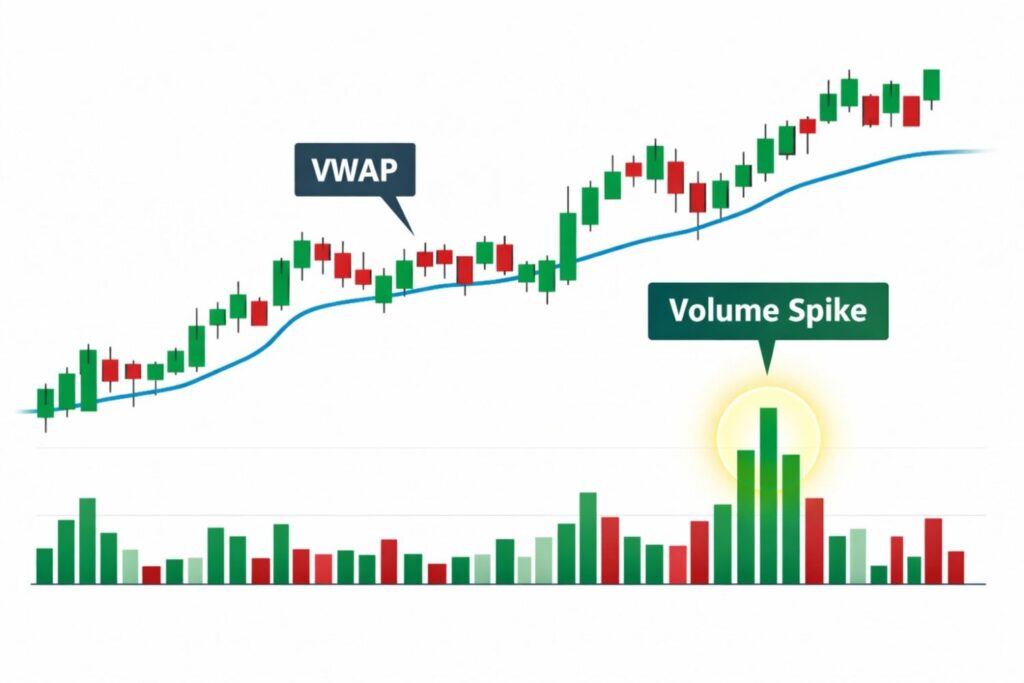
Helps detect unusual volume spikes.
4. VWAP (Volume Weighted Average Price)
Used by intraday traders to find fair price level.
Simple Volume Trading Rules for Beginners
- Always confirm breakout with high volume
- Avoid trades when volume is very low
- Rising price + rising volume = strong signal
- Rising price + falling volume = warning sign
- Big volume near support/resistance = possible reversal
Advantages of Volume Analysis
✔ Confirms real trends
✔ Filters false breakouts
✔ Improves entry timing
✔ Useful in stocks, crypto, and commodities
Limitations You Should Know
❌ Volume alone is not enough
❌ Must combine with price action or indicators
❌ News events can suddenly change volume
Conclusion
Volume is like the heartbeat of the market.
- Price tells what is happening
- Volume tells how strong it is
If you learn to read volume correctly,
you can avoid fake moves, catch real trends, and trade with more confidence.
That’s why experienced traders always say:
“Never trust price without volume confirmation.”
Frequently Asked Questions (FAQ)
What is good volume for a breakout?
A breakout is strong when volume is higher than recent average volume.
Can volume predict market reversal?
Yes, sometimes.
Falling volume during an uptrend can signal a possible reversal.
Which volume indicator is best for beginners?
Start with:
Simple volume bars
Then learn VWAP or OBV
Does volume work in intraday trading?
Yes.
Intraday traders heavily rely on volume spikes and VWAP levels.