Introduction
If you have ever watched professional traders or institutions execute large trades, you may have noticed that price often reacts around a specific average level during the trading day. That level is known as VWAP (Volume Weighted Average Price).
VWAP is one of the most trusted intraday indicators used by institutional traders, hedge funds, and professional market participants. Unlike simple averages, VWAP combines price and volume, giving a clearer picture of the true average trading price of an asset throughout the day.
What is VWAP?
VWAP stands for Volume Weighted Average Price. It represents the average price at which a stock has traded during the day, weighted by volume.
This means:
- Trades with higher volume have more impact on VWAP
- Trades with low volume have less impact
Because of this, VWAP reflects the true market consensus price rather than just a simple average.
VWAP Symbol & Formula
Symbol
VWAP
Formula
VWAP is calculated using the following steps:
- Calculate Typical Price: (High+Low+Close)÷3(High + Low + Close) ÷ 3(High+Low+Close)÷3
- Multiply Typical Price by Volume
- Divide cumulative value by cumulative volume
VWAP = Σ (Typical Price × Volume) ÷ Σ Volume
Most trading platforms calculate VWAP automatically, so traders usually don’t need to compute it manually.
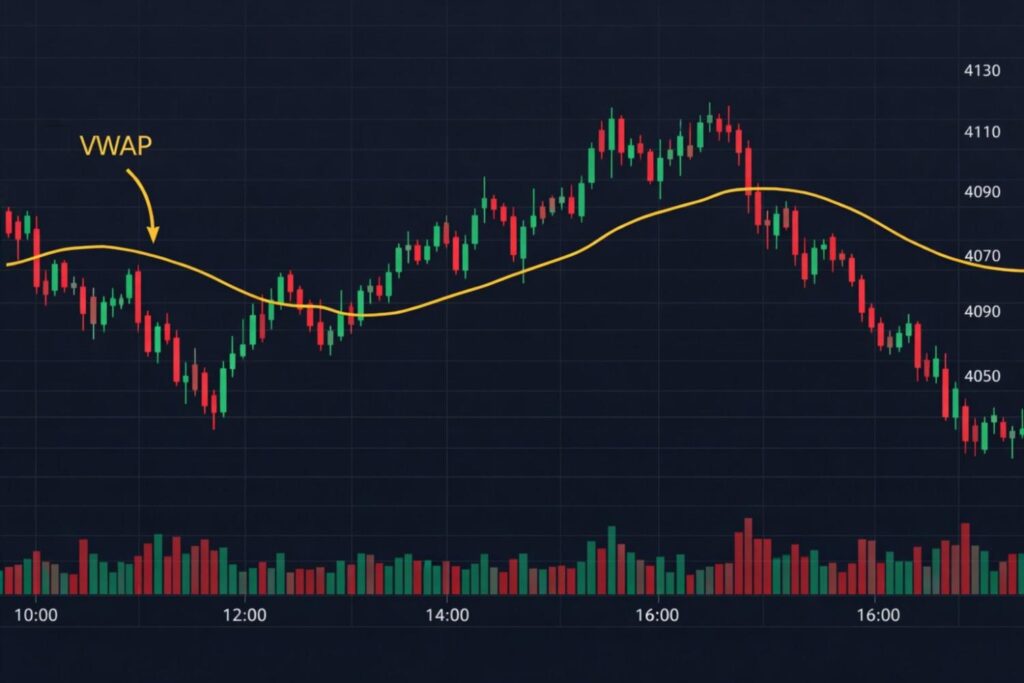
How VWAP Appears on a Chart ?
VWAP is displayed as a single smooth line running across the intraday chart.
General interpretation:
- Price above VWAP → bullish intraday sentiment
- Price below VWAP → bearish intraday sentiment
- Price near VWAP → fair value zone
Why Institutional Traders Love VWAP ?
Institutional traders handle large order sizes. Entering the market at the wrong price can significantly impact their profits.
VWAP helps them:
- Buy below VWAP to get a better‑than‑average price
- Sell above VWAP to secure higher value
- Measure execution quality of trades
Because many institutions watch VWAP, it often behaves like dynamic support or resistance.
Real‑Time Trading Example
Imagine a stock opens at ₹100 and quickly moves to ₹103 with strong volume. Later, the price pulls back toward ₹101 where VWAP is located.
Professional traders may:
- Buy near VWAP if overall trend is bullish
- Place stop‑loss slightly below VWAP
- Target previous high around ₹103 or higher
This makes VWAP a powerful intraday decision‑making tool.
Popular VWAP Trading Strategies
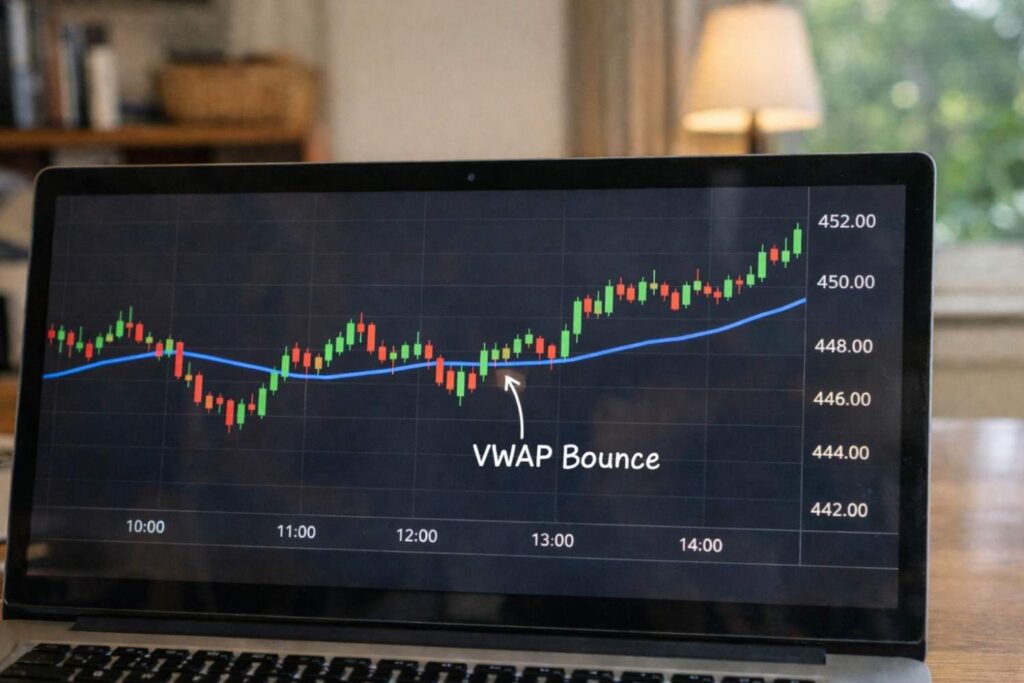
1. VWAP Bounce Strategy
- Wait for price to trend above VWAP
- Enter when price pulls back and holds VWAP
- Target recent high
Best used in strong trending markets.
2. VWAP Breakout Strategy
- Observe consolidation below VWAP
- Enter when price breaks and holds above VWAP with volume
- Ride intraday momentum
Useful during high‑volume sessions.
3. VWAP Reversal Strategy
- Look for extended move far from VWAP
- Enter counter‑trend toward VWAP mean
Works best in range‑bound markets.
VWAP vs Moving Average
| Feature | VWAP | Moving Average |
|---|---|---|
| Includes Volume | Yes | No |
| Reset Timing | Daily | Continuous |
| Best For | Intraday trading | Trend analysis |
| Institutional Usage | Very High | Moderate |
VWAP is generally more reliable for intraday trades, while moving averages are better for swing or long‑term trends.
Common Mistakes Traders Make
- Using VWAP for long‑term investing (it resets daily)
- Trading every VWAP touch without trend confirmation
- Ignoring volume strength during breakouts
Frequently Asked Questions (FAQ)
Can beginners use VWAP?
Absolutely. VWAP is simple to read and one of the easiest professional indicators to learn.
Which timeframe works best with VWAP?
Most traders use 5‑minute or 15‑minute charts for clear signals.
Is VWAP better than RSI or MACD
VWAP serves a different purpose. It measures fair price and institutional activity, while RSI and MACD measure momentum.
Does VWAP work in all markets?
Yes. VWAP is used in stocks, indices, forex, and crypto—especially where volume data is reliable.